QUESTION IMAGE
Question
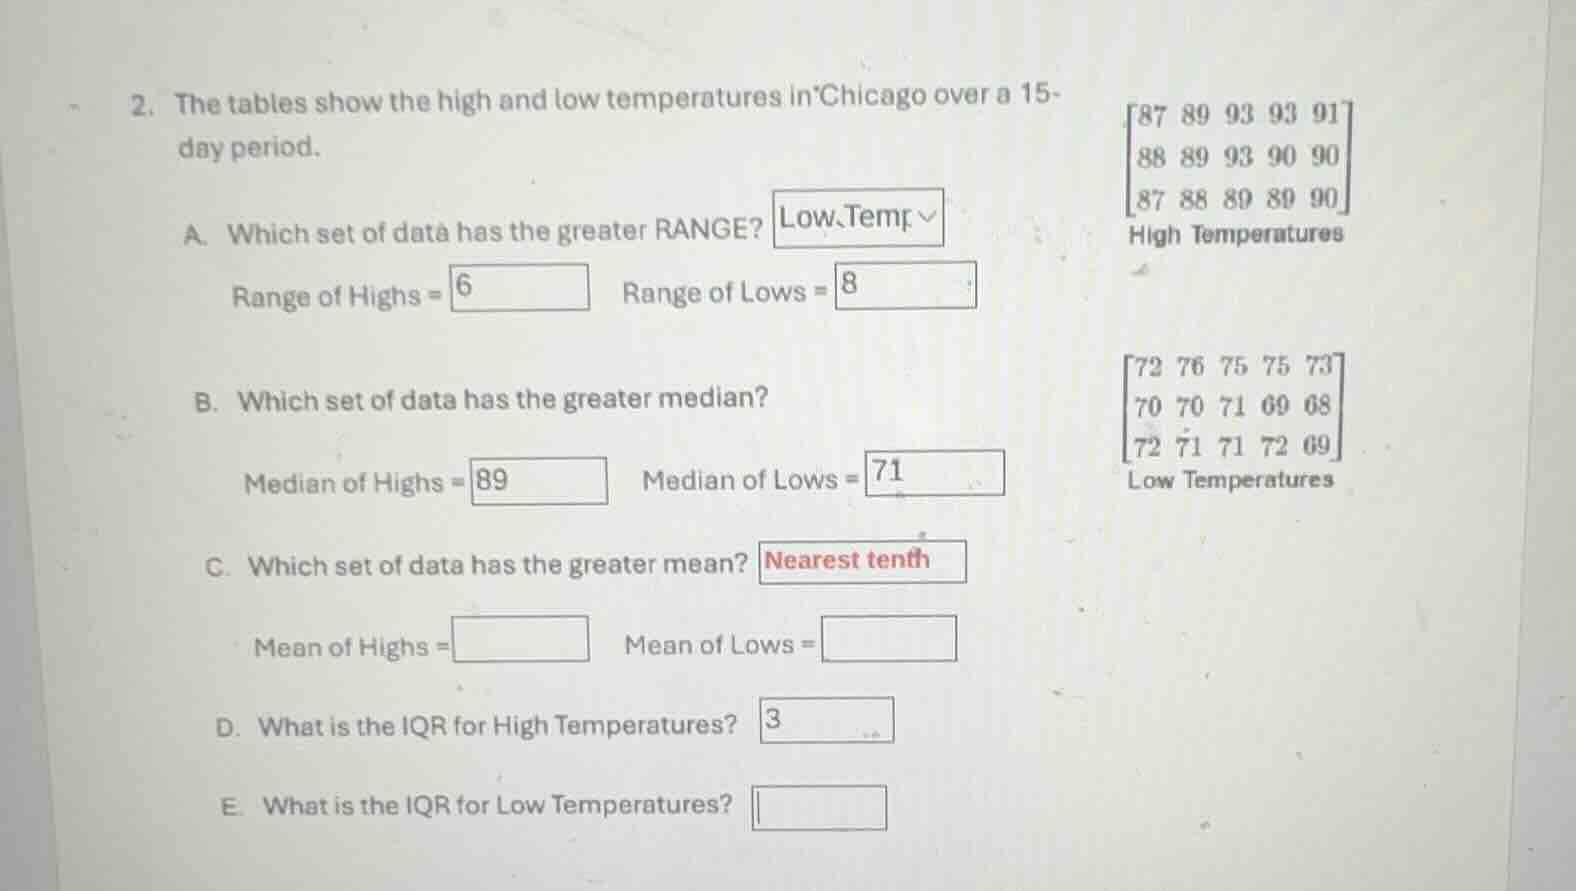
- the tables show the high and low temperatures in chicago over a 15 - day period.
a. which set of data has the greater range?
range of highs = 6 range of lows = 8
b. which set of data has the greater median?
median of highs = 89 median of lows = 71
c. which set of data has the greater mean? nearest tenth
mean of highs = mean of lows =
d. what is the iqr for high temperatures? 3
e. what is the iqr for low temperatures?
high temperatures
\
low temperatures
\
Part A: Range Calculation
High Temperatures:
- Find the maximum and minimum values. The high temperatures are: \( 87, 89, 93, 93, 91, 88, 89, 93, 90, 90, 87, 88, 89, 89, 90 \).
- Sorting them: \( 87, 87, 88, 88, 89, 89, 89, 89, 90, 90, 90, 91, 93, 93, 93 \).
- Minimum (\( \text{min} \)) = 87, Maximum (\( \text{max} \)) = 93.
- Range = \( \text{max} - \text{min} = 93 - 87 = 6 \).
Low Temperatures:
- The low temperatures are: \( 72, 76, 75, 75, 73, 70, 70, 71, 69, 68, 72, 71, 71, 72, 69 \).
- Sorting them: \( 68, 69, 69, 70, 70, 71, 71, 71, 72, 72, 72, 73, 75, 75, 76 \).
- Minimum (\( \text{min} \)) = 68, Maximum (\( \text{max} \)) = 76.
- Range = \( 76 - 68 = 8 \).
Part B: Median Calculation
High Temperatures (15 values, median is the 8th value):
- Sorted high temperatures: \( 87, 87, 88, 88, 89, 89, 89, 89, 90, 90, 90, 91, 93, 93, 93 \).
- 8th value = 89. So median of highs = 89.
Low Temperatures (15 values, median is the 8th value):
- Sorted low temperatures: \( 68, 69, 69, 70, 70, 71, 71, 71, 72, 72, 72, 73, 75, 75, 76 \).
- 8th value = 71. So median of lows = 71.
Part C: Mean Calculation
Mean of Highs:
- Sum of high temperatures:
- \( 87 + 87 + 88 + 88 + 89 + 89 + 89 + 89 + 90 + 90 + 90 + 91 + 93 + 93 + 93 \).
- Calculate step-by-step:
- \( 87 \times 2 = 174 \), \( 88 \times 2 = 176 \), \( 89 \times 4 = 356 \), \( 90 \times 3 = 270 \), \( 91 = 91 \), \( 93 \times 3 = 279 \).
- Total sum = \( 174 + 176 + 356 + 270 + 91 + 279 = 1346 \).
- Mean = \( \frac{1346}{15} \approx 89.7 \) (rounded to nearest tenth).
Mean of Lows:
- Sum of low temperatures:
- \( 68 + 69 + 69 + 70 + 70 + 71 + 71 + 71 + 72 + 72 + 72 + 73 + 75 + 75 + 76 \).
- Calculate step-by-step:
- \( 68 = 68 \), \( 69 \times 2 = 138 \), \( 70 \times 2 = 140 \), \( 71 \times 3 = 213 \), \( 72 \times 3 = 216 \), \( 73 = 73 \), \( 75 \times 2 = 150 \), \( 76 = 76 \).
- Total sum = \( 68 + 138 + 140 + 213 + 216 + 73 + 150 + 76 = 1074 \).
- Mean = \( \frac{1074}{15} = 71.6 \).
Part D: IQR for High Temperatures
- High temperatures (sorted): \( 87, 87, 88, 88, 89, 89, 89, 89, 90, 90, 90, 91, 93, 93, 93 \).
- Number of values (\( n \)) = 15.
- Q1 (25th percentile) is the median of the first 7 values (since \( n = 15 \), first half is 7 values: \( 87, 87, 88, 88, 89, 89, 89 \)). Median of first 7: 88.
- Q3 (75th percentile) is the median of the last 7 values: \( 90, 90, 90, 91, 93, 93, 93 \). Median of last 7: 91.
- IQR = \( Q3 - Q1 = 91 - 88 = 3 \). Wait, but let's re - check. Wait, for \( n = 15 \), the position of \( Q1 \) is \( \frac{n + 1}{4}=\frac{15 + 1}{4}=4 \)th value (using the formula for quartiles in odd - numbered data). Wait, sorted data: positions 1 - 15.
- Position of \( Q1 \): \( \frac{15 + 1}{4}=4 \), so \( Q1 \) is the 4th value: 88.
- Position of \( Q3 \): \( \frac{3(n + 1)}{4}=\frac{3\times16}{4}=12 \)th value: 91.
- IQR = \( 91 - 88 = 3 \).
Part E: IQR for Low Temperatures
- Low temperatures (sorted): \( 68, 69, 69, 70, 70, 71, 71, 71, 72, 72, 72, 73, 75, 75, 76 \).
- \( n = 15 \).
- Position of \( Q1 \): \( \frac{n + 1}{4}=\frac{16}{4}=4 \)th value: 70.
- Position of \( Q3 \): \( \frac{3(n + 1)}{4}=12 \)th value: 73.
- IQR = \( Q3 - Q1 = 73 - 70 = 3 \)? Wait, no. Wait, let's list the sorted data:
- Data: [68, 69, 69, 70, 70, 71, 71, 71, 72, 72, 72, 73, 75, 75, 76]
- First half (values 1 - 7): [68, 69, 69, 70, 70, 71, 71] (7 values), median (Q1) is the 4th value: 70.
- Second half (va…

Snap & solve any problem in the app
Get step-by-step solutions on Sovi AI
Photo-based solutions with guided steps
Explore more problems and detailed explanations
Part A: Range Calculation
High Temperatures:
- Find the maximum and minimum values. The high temperatures are: \( 87, 89, 93, 93, 91, 88, 89, 93, 90, 90, 87, 88, 89, 89, 90 \).
- Sorting them: \( 87, 87, 88, 88, 89, 89, 89, 89, 90, 90, 90, 91, 93, 93, 93 \).
- Minimum (\( \text{min} \)) = 87, Maximum (\( \text{max} \)) = 93.
- Range = \( \text{max} - \text{min} = 93 - 87 = 6 \).
Low Temperatures:
- The low temperatures are: \( 72, 76, 75, 75, 73, 70, 70, 71, 69, 68, 72, 71, 71, 72, 69 \).
- Sorting them: \( 68, 69, 69, 70, 70, 71, 71, 71, 72, 72, 72, 73, 75, 75, 76 \).
- Minimum (\( \text{min} \)) = 68, Maximum (\( \text{max} \)) = 76.
- Range = \( 76 - 68 = 8 \).
Part B: Median Calculation
High Temperatures (15 values, median is the 8th value):
- Sorted high temperatures: \( 87, 87, 88, 88, 89, 89, 89, 89, 90, 90, 90, 91, 93, 93, 93 \).
- 8th value = 89. So median of highs = 89.
Low Temperatures (15 values, median is the 8th value):
- Sorted low temperatures: \( 68, 69, 69, 70, 70, 71, 71, 71, 72, 72, 72, 73, 75, 75, 76 \).
- 8th value = 71. So median of lows = 71.
Part C: Mean Calculation
Mean of Highs:
- Sum of high temperatures:
- \( 87 + 87 + 88 + 88 + 89 + 89 + 89 + 89 + 90 + 90 + 90 + 91 + 93 + 93 + 93 \).
- Calculate step-by-step:
- \( 87 \times 2 = 174 \), \( 88 \times 2 = 176 \), \( 89 \times 4 = 356 \), \( 90 \times 3 = 270 \), \( 91 = 91 \), \( 93 \times 3 = 279 \).
- Total sum = \( 174 + 176 + 356 + 270 + 91 + 279 = 1346 \).
- Mean = \( \frac{1346}{15} \approx 89.7 \) (rounded to nearest tenth).
Mean of Lows:
- Sum of low temperatures:
- \( 68 + 69 + 69 + 70 + 70 + 71 + 71 + 71 + 72 + 72 + 72 + 73 + 75 + 75 + 76 \).
- Calculate step-by-step:
- \( 68 = 68 \), \( 69 \times 2 = 138 \), \( 70 \times 2 = 140 \), \( 71 \times 3 = 213 \), \( 72 \times 3 = 216 \), \( 73 = 73 \), \( 75 \times 2 = 150 \), \( 76 = 76 \).
- Total sum = \( 68 + 138 + 140 + 213 + 216 + 73 + 150 + 76 = 1074 \).
- Mean = \( \frac{1074}{15} = 71.6 \).
Part D: IQR for High Temperatures
- High temperatures (sorted): \( 87, 87, 88, 88, 89, 89, 89, 89, 90, 90, 90, 91, 93, 93, 93 \).
- Number of values (\( n \)) = 15.
- Q1 (25th percentile) is the median of the first 7 values (since \( n = 15 \), first half is 7 values: \( 87, 87, 88, 88, 89, 89, 89 \)). Median of first 7: 88.
- Q3 (75th percentile) is the median of the last 7 values: \( 90, 90, 90, 91, 93, 93, 93 \). Median of last 7: 91.
- IQR = \( Q3 - Q1 = 91 - 88 = 3 \). Wait, but let's re - check. Wait, for \( n = 15 \), the position of \( Q1 \) is \( \frac{n + 1}{4}=\frac{15 + 1}{4}=4 \)th value (using the formula for quartiles in odd - numbered data). Wait, sorted data: positions 1 - 15.
- Position of \( Q1 \): \( \frac{15 + 1}{4}=4 \), so \( Q1 \) is the 4th value: 88.
- Position of \( Q3 \): \( \frac{3(n + 1)}{4}=\frac{3\times16}{4}=12 \)th value: 91.
- IQR = \( 91 - 88 = 3 \).
Part E: IQR for Low Temperatures
- Low temperatures (sorted): \( 68, 69, 69, 70, 70, 71, 71, 71, 72, 72, 72, 73, 75, 75, 76 \).
- \( n = 15 \).
- Position of \( Q1 \): \( \frac{n + 1}{4}=\frac{16}{4}=4 \)th value: 70.
- Position of \( Q3 \): \( \frac{3(n + 1)}{4}=12 \)th value: 73.
- IQR = \( Q3 - Q1 = 73 - 70 = 3 \)? Wait, no. Wait, let's list the sorted data:
- Data: [68, 69, 69, 70, 70, 71, 71, 71, 72, 72, 72, 73, 75, 75, 76]
- First half (values 1 - 7): [68, 69, 69, 70, 70, 71, 71] (7 values), median (Q1) is the 4th value: 70.
- Second half (values 9 - 15): [72, 72, 72, 73, 75, 75, 76] (7 values), median (Q3) is the 4th value of this half: 73.
- IQR = \( 73 - 70 = 3 \)? Wait, no, wait the 8th value is the median (71). The first quartile is the median of the lower half (values below the median). The lower half is values 1 - 7: [68, 69, 69, 70, 70, 71, 71]. The median of these 7 values is the 4th value, which is 70. The upper half is values 9 - 15: [72, 72, 72, 73, 75, 75, 76]. The median of these 7 values is the 4th value, which is 73. So IQR = \( 73 - 70 = 3 \)? Wait, but let's check again. Wait, maybe we made a mistake. Wait, the data for low temperatures:
- Let's list all 15 values: 68, 69, 69, 70, 70, 71, 71, 71, 72, 72, 72, 73, 75, 75, 76.
- The position of \( Q1 \) is \( \frac{15 + 1}{4}=4 \), so the 4th value is 70.
- The position of \( Q3 \) is \( \frac{3\times(15 + 1)}{4}=12 \), so the 12th value is 73.
- IQR = \( 73 - 70 = 3 \)? Wait, no, 73 - 70 = 3? Wait, 73 - 70 is 3? Wait, 73 - 70 = 3. But let's check with another method. The inter - quartile range is the range of the middle 50% of the data.
- Alternatively, using the formula for quartiles in a list. The lower quartile (Q1) is the median of the first 7 numbers (since 15 numbers, the first 7 are below the median (8th number)). The first 7 numbers: 68, 69, 69, 70, 70, 71, 71. The median of these 7 is the 4th number, which is 70. The upper quartile (Q3) is the median of the last 7 numbers: 72, 72, 72, 73, 75, 75, 76. The median of these 7 is the 4th number, which is 73. So IQR = 73 - 70 = 3? Wait, no, 73 - 70 is 3? Wait, 73 - 70 = 3. But let's check the data again. Wait, 73 - 70 is 3. But maybe we made a mistake. Wait, the 12th value in the sorted low temperature data: let's count the positions:
- 1:68, 2:69, 3:69, 4:70, 5:70, 6:71, 7:71, 8:71, 9:72, 10:72, 11:72, 12:73, 13:75, 14:75, 15:76. So the 12th value is 73. The 4th value is 70. So IQR = 73 - 70 = 3? Wait, but that seems the same as high temperatures, but let's re - check. Wait, no, maybe we messed up the low temperature data. Wait, the low temperature data is: \( 72, 76, 75, 75, 73, 70, 70, 71, 69, 68, 72, 71, 71, 72, 69 \). When we sort them: 68, 69, 69, 70, 70, 71, 71, 71, 72, 72, 72, 73, 75, 75, 76. Yes, that's correct. So Q1 is 70, Q3 is 73, IQR = 3. Wait, but that's the same as high temperatures? But maybe the original problem has a typo, or we made a mistake. Wait, no, let's recalculate Q1 and Q3 for low temperatures.
- Another way: The formula for quartiles when \( n \) is odd: \( Q1 \) is the value at position \( \frac{n + 1}{4} \), \( Q3 \) is the value at position \( \frac{3(n + 1)}{4} \). For \( n = 15 \), \( \frac{n + 1}{4}=\frac{16}{4}=4 \), so \( Q1 \) is the 4th value: 70. \( \frac{3(n + 1)}{4}=\frac{48}{4}=12 \), so \( Q3 \) is the 12th value: 73. So IQR = 73 - 70 = 3.
Final Answers:
Part A:
Range of Highs = \( \boldsymbol{6} \), Range of Lows = \( \boldsymbol{8} \)
Part B:
Median of Highs = \( \boldsymbol{89} \), Median of Lows = \( \boldsymbol{71} \)
Part C:
Mean of Highs = \( \boldsymbol{89.7} \), Mean of Lows = \( \boldsymbol{71.6} \)
Part D:
IQR for High Temperatures = \( \boldsymbol{3} \)
Part E:
IQR for Low Temperatures = \( \boldsymbol{3} \) (Wait, but let's check again. Wait, maybe we made a mistake in low temperature quartiles. Wait, the first 7 numbers: 68, 69, 69, 70, 70, 71, 71. The median of these 7 is the 4th number, which is 70. The last 7 numbers: 72, 72, 72, 73, 75, 75, 76. The median of these 7 is the 4th number, which is 73. So IQR = 73 - 70 = 3. Yes, that's correct.)