QUESTION IMAGE
Question
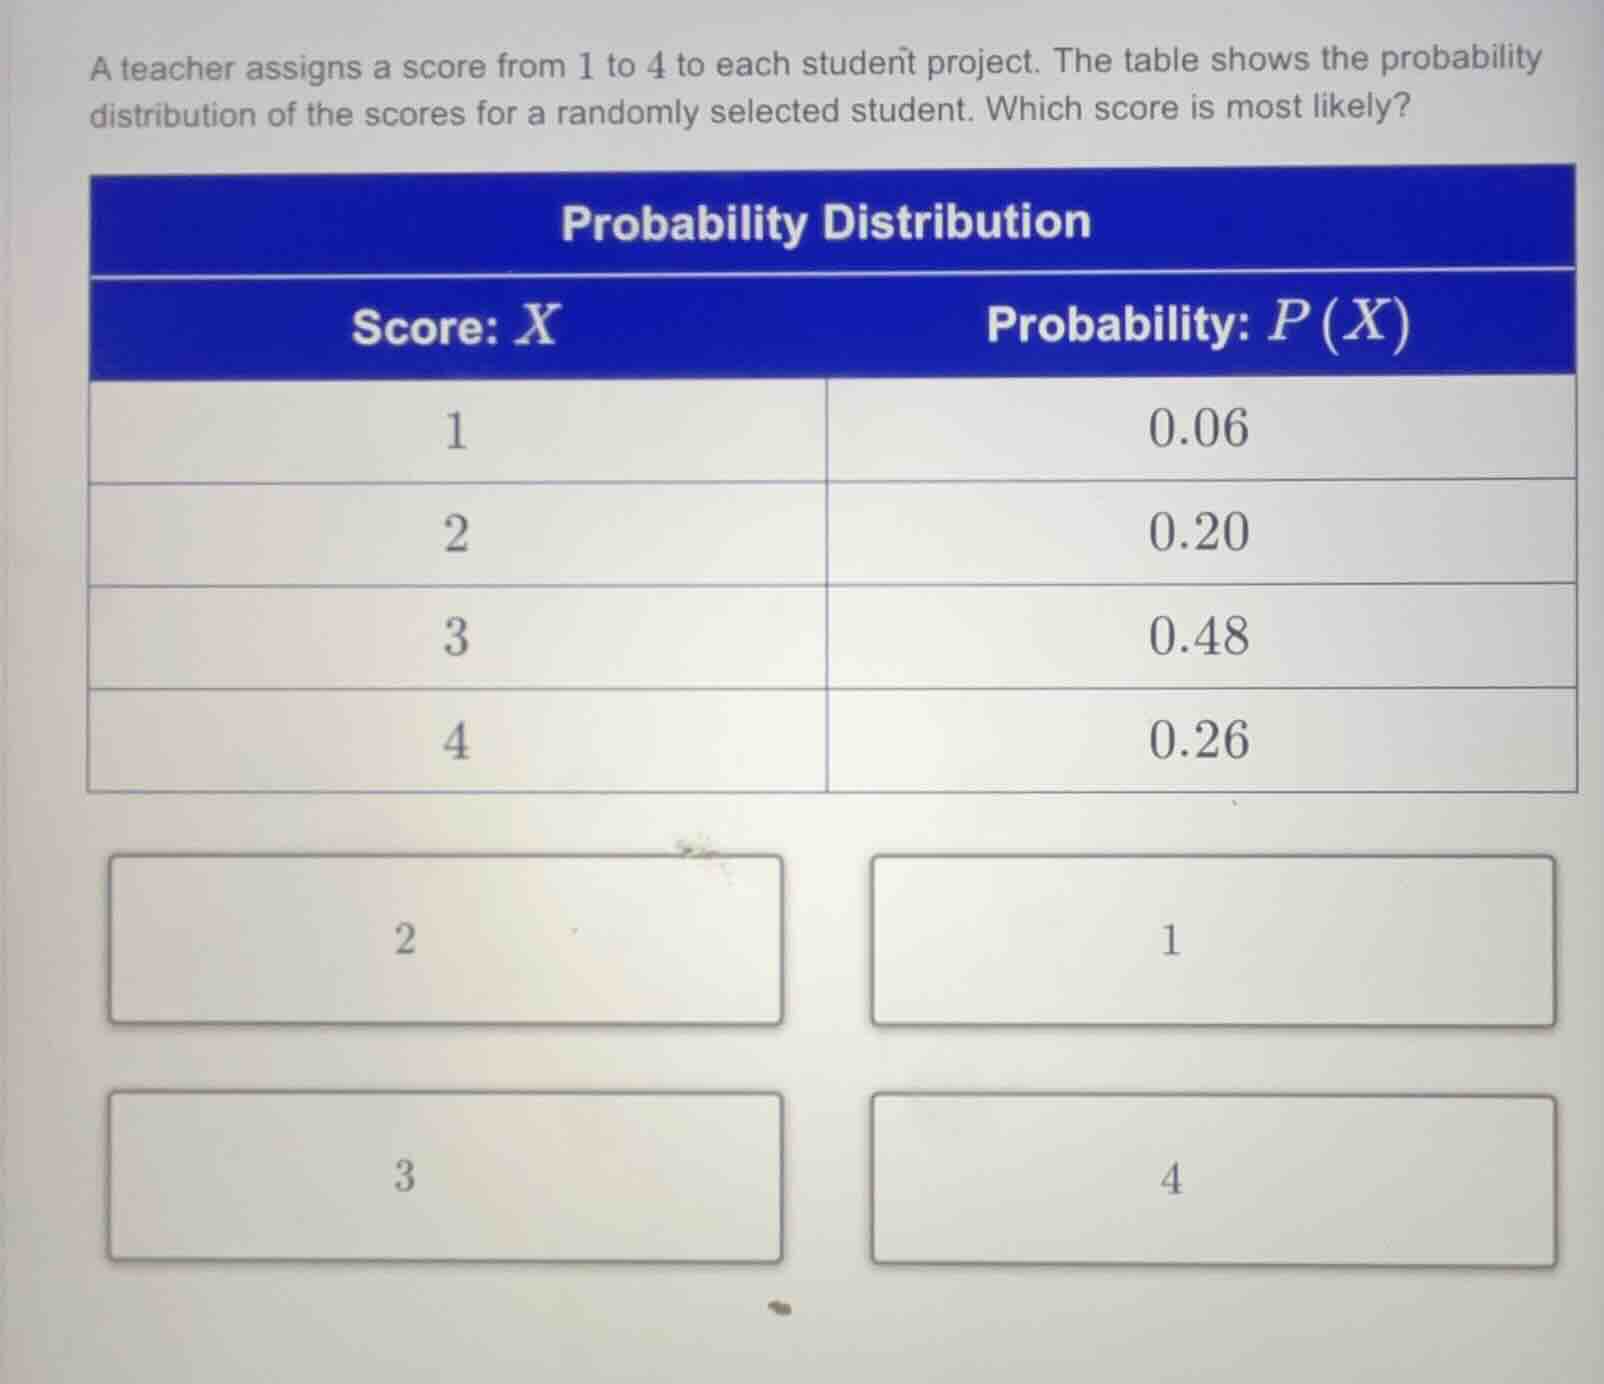
a teacher assigns a score from 1 to 4 to each student project. the table shows the probability distribution of the scores for a randomly selected student. which score is most likely? probability distribution score: x probability: p(x) 1 0.06 2 0.20 3 0.48 4 0.26 2 1 3 4
Step1: Compare probabilities
We have the probabilities for each score: \( P(1) = 0.06 \), \( P(2) = 0.20 \), \( P(3) = 0.48 \), \( P(4) = 0.26 \).
Step2: Identify the maximum probability
Among \( 0.06 \), \( 0.20 \), \( 0.48 \), and \( 0.26 \), the largest value is \( 0.48 \), which corresponds to the score \( 3 \).

Snap & solve any problem in the app
Get step-by-step solutions on Sovi AI
Photo-based solutions with guided steps
Explore more problems and detailed explanations
3