QUESTION IMAGE
Question
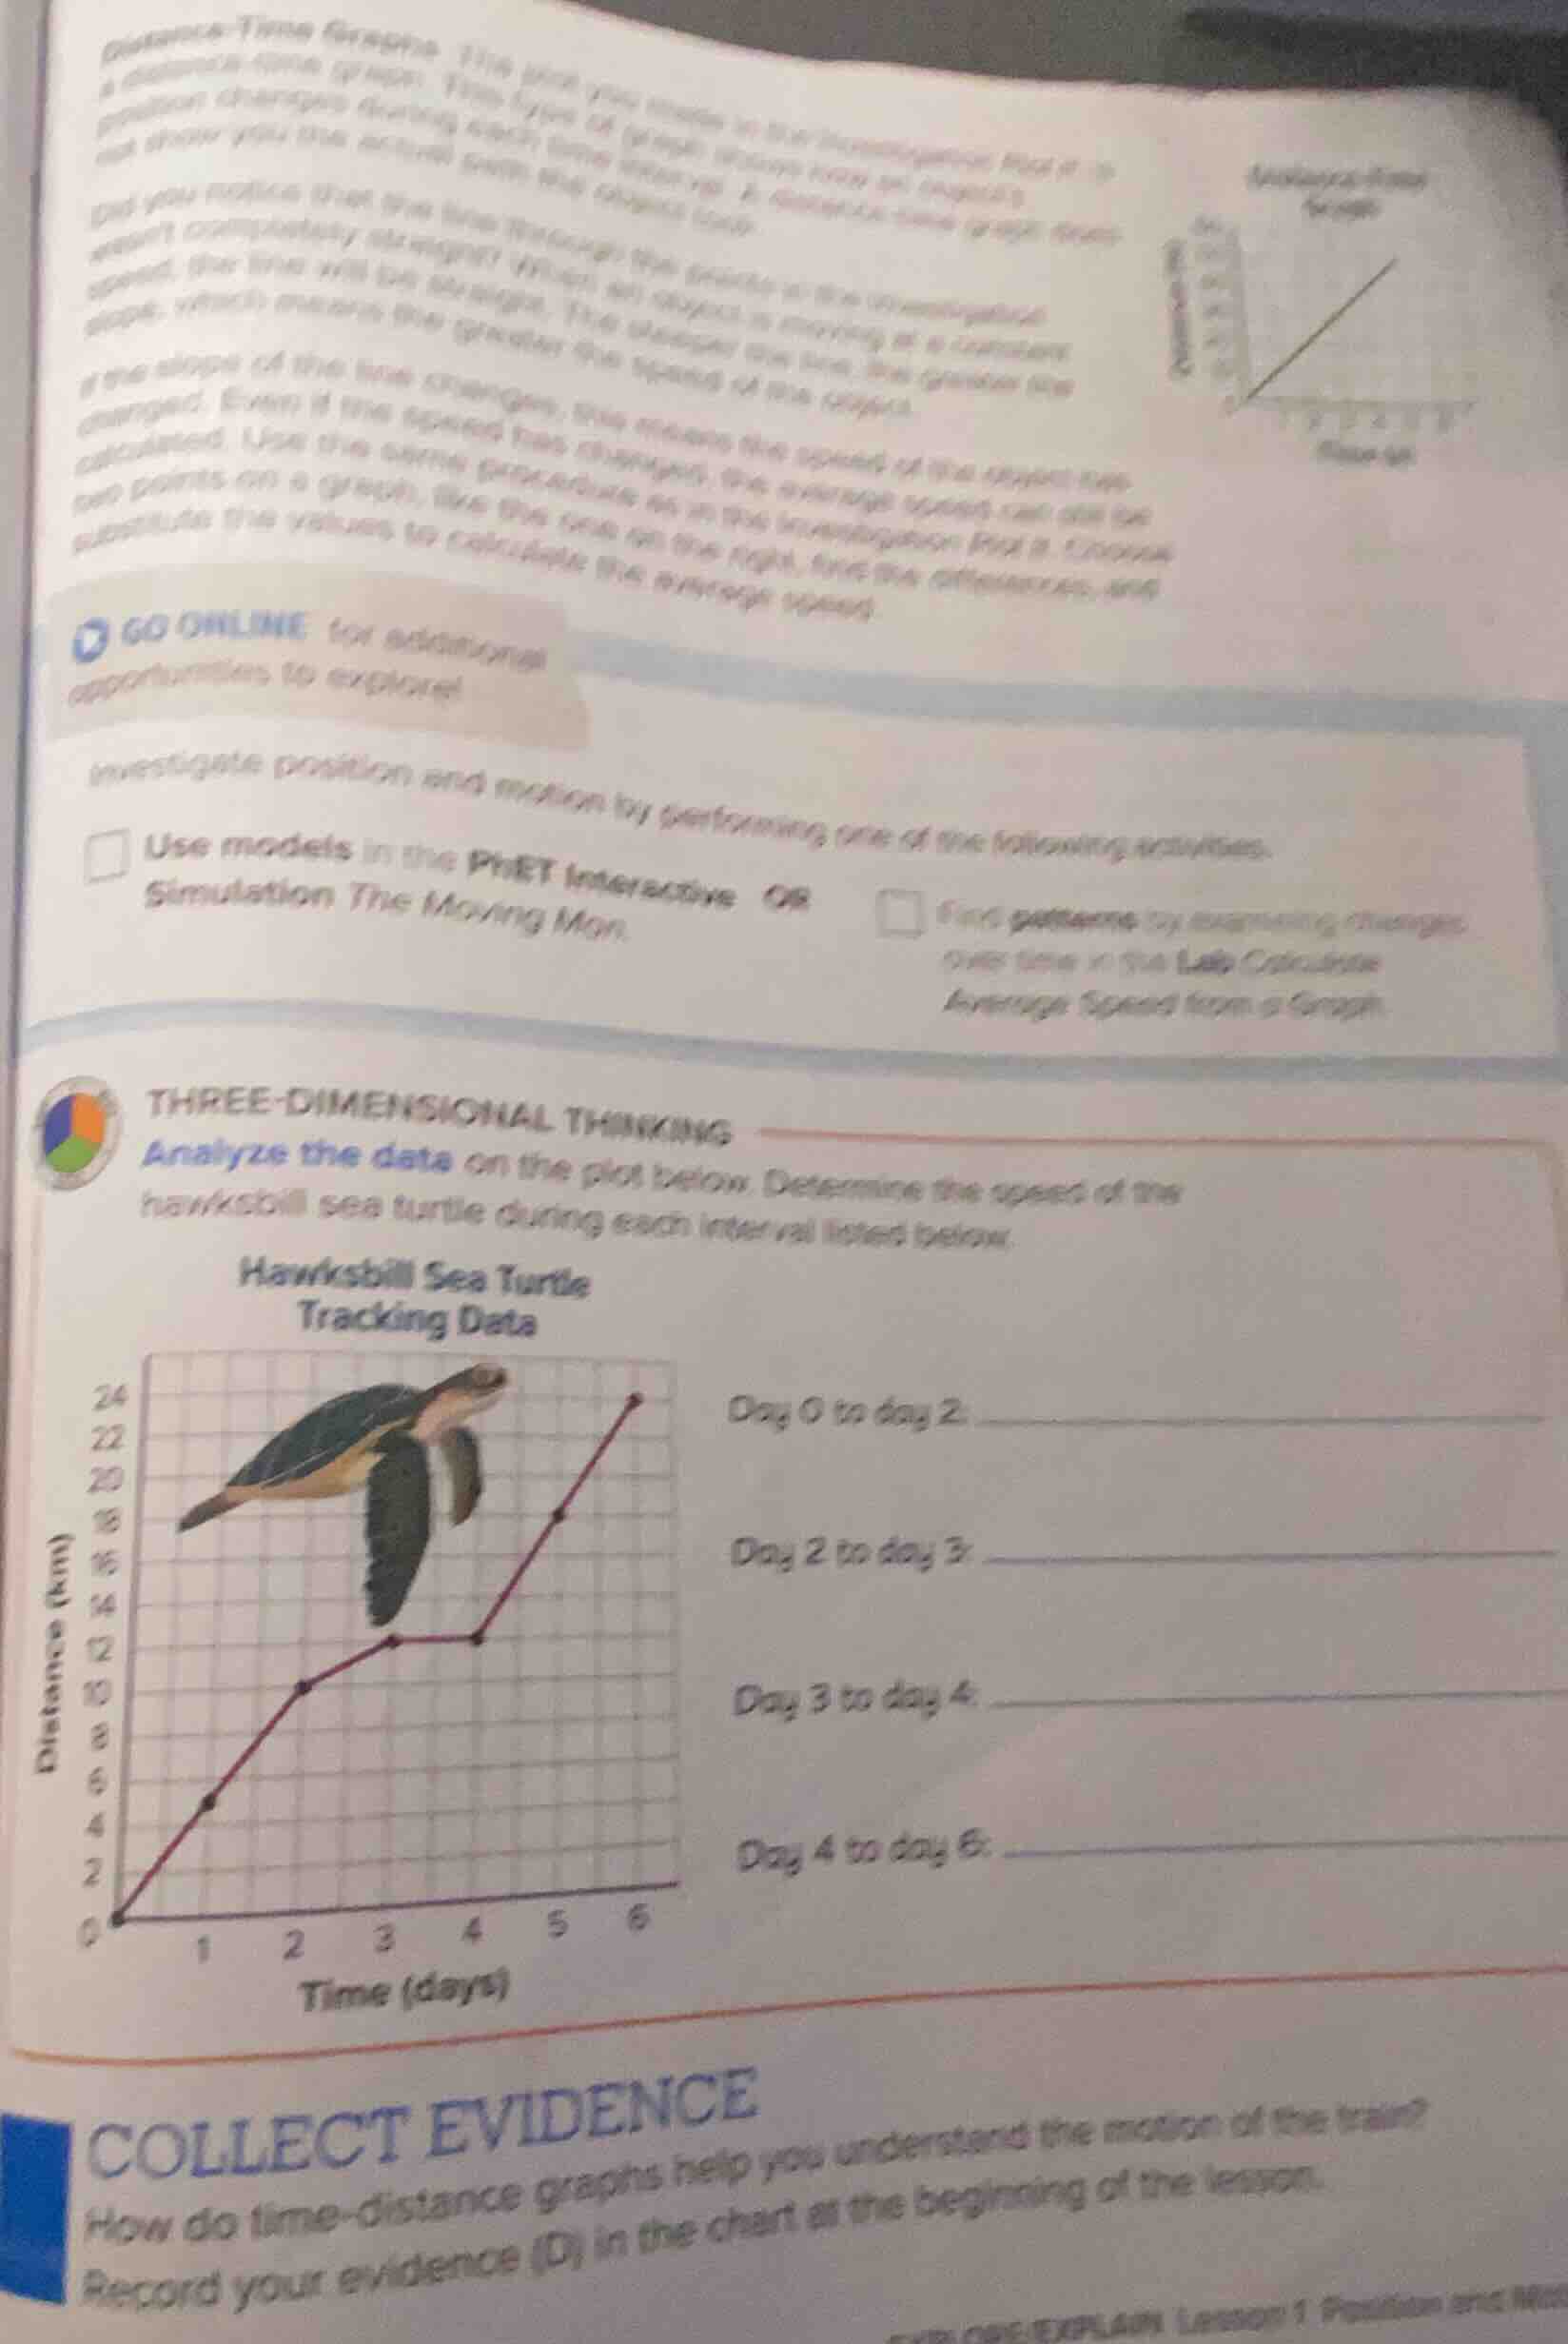
three - dimensional thinking
analyze the data on the plot below. determine the speed of the hawksbill sea turtle during each interval listed below.
hawksbill sea turtle
tracking data
day 0 to day 2:
day 2 to day 3:
day 3 to day 4:
day 4 to day 6:
Step1: Recall speed formula
Speed = $\frac{\text{Change in Distance}}{\text{Change in Time}}$
Step2: Calculate Day 0 to Day 2
Distance change: $10 - 0 = 10$ km; Time change: $2 - 0 = 2$ days
$\text{Speed} = \frac{10}{2} = 5$ km/day
Step3: Calculate Day 2 to Day 3
Distance change: $12 - 10 = 2$ km; Time change: $3 - 2 = 1$ day
$\text{Speed} = \frac{2}{1} = 2$ km/day
Step4: Calculate Day 3 to Day 4
Distance change: $12 - 12 = 0$ km; Time change: $4 - 3 = 1$ day
$\text{Speed} = \frac{0}{1} = 0$ km/day
Step5: Calculate Day 4 to Day 6
Distance change: $24 - 12 = 12$ km; Time change: $6 - 4 = 2$ days
$\text{Speed} = \frac{12}{2} = 6$ km/day

Snap & solve any problem in the app
Get step-by-step solutions on Sovi AI
Photo-based solutions with guided steps
Explore more problems and detailed explanations
Day 0 to day 2: 5 km/day
Day 2 to day 3: 2 km/day
Day 3 to day 4: 0 km/day
Day 4 to day 6: 6 km/day