QUESTION IMAGE
Question
three - dimensional thinking
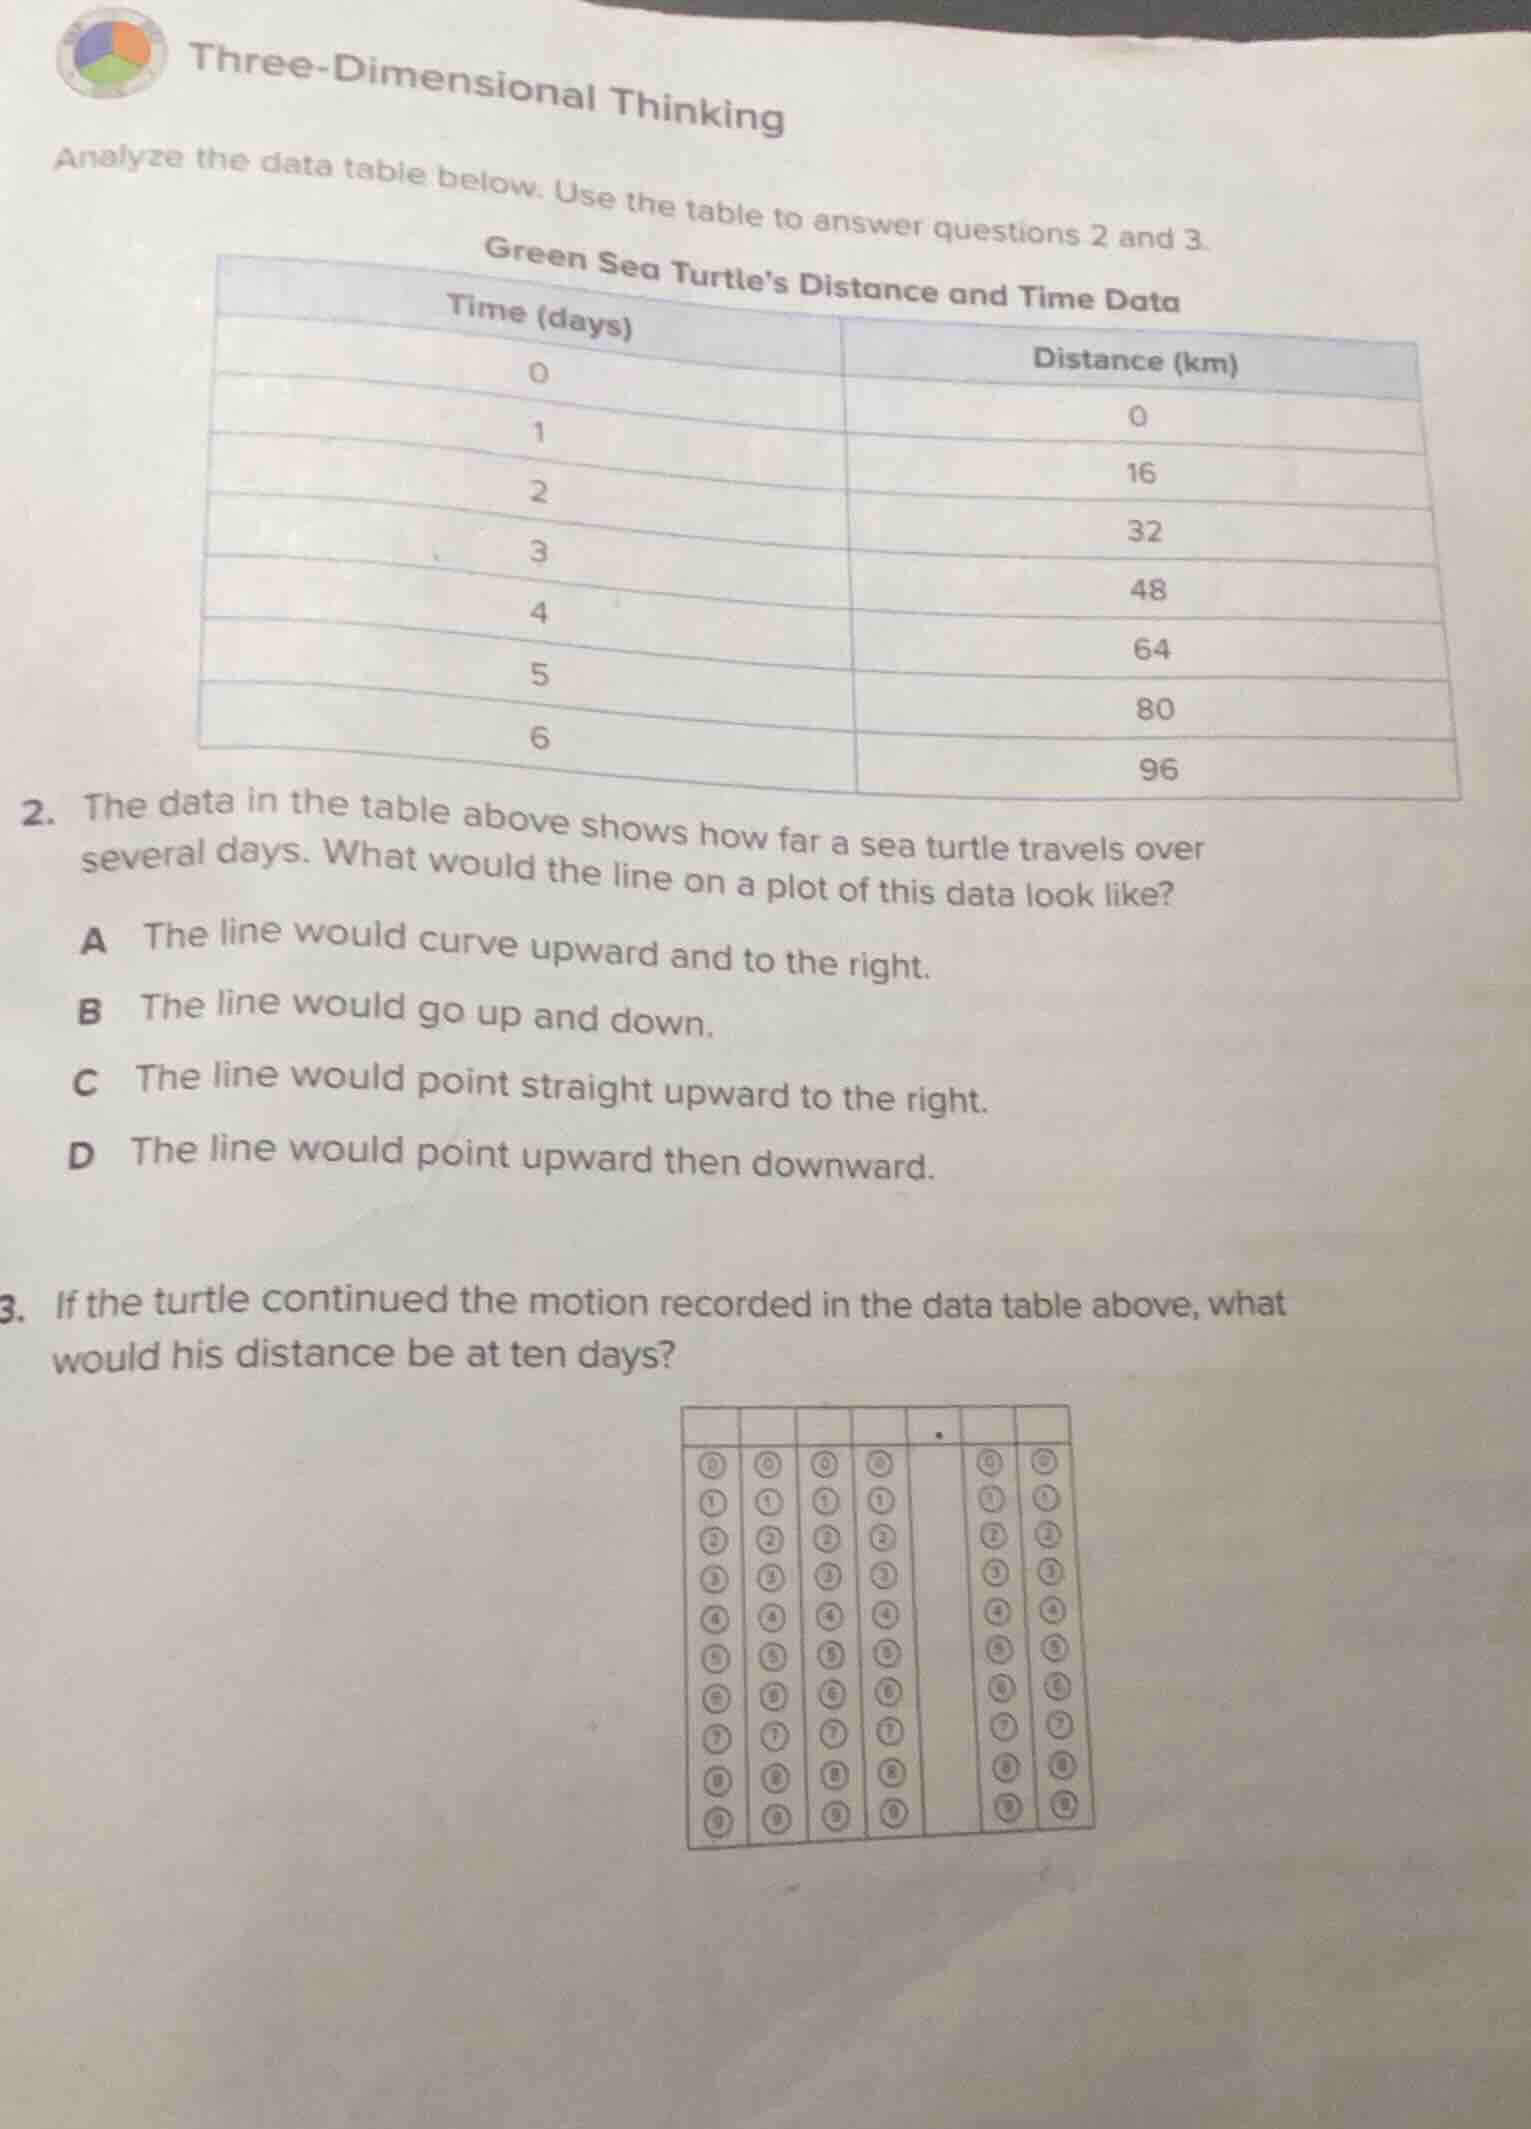
analyze the data table below. use the table to answer questions 2 and 3.
green sea turtles distance and time data
| time (days) | distance (km) |
|---|---|
| 1 | 16 |
| 2 | 32 |
| 3 | 48 |
| 4 | 64 |
| 5 | 80 |
| 6 | 96 |
- the data in the table above shows how far a sea turtle travels over several days. what would the line on a plot of this data look like?
a the line would curve upward and to the right.
b the line would go up and down.
c the line would point straight upward to the right.
d the line would point upward then downward.
- if the turtle continued the motion recorded in the data table above, what would his distance be at ten days?
Step1: Identify relationship type
Check distance change per day:
$\Delta d_1 = 16-0=16$, $\Delta d_2=32-16=16$, $\Delta d_3=48-32=16$, etc.
Step2: Answer question 2
Since distance increases by a constant 16 km each day, the relationship is linear, so the plot line is straight upward to the right.
Step3: Find daily distance rate
Daily distance = $\frac{16}{1}=16$ km/day
Step4: Calculate distance at 10 days
Distance = $16 \times 10 = 160$ km

Snap & solve any problem in the app
Get step-by-step solutions on Sovi AI
Photo-based solutions with guided steps
Explore more problems and detailed explanations
- C The line would point straight upward to the right.
- 160 km