QUESTION IMAGE
Question
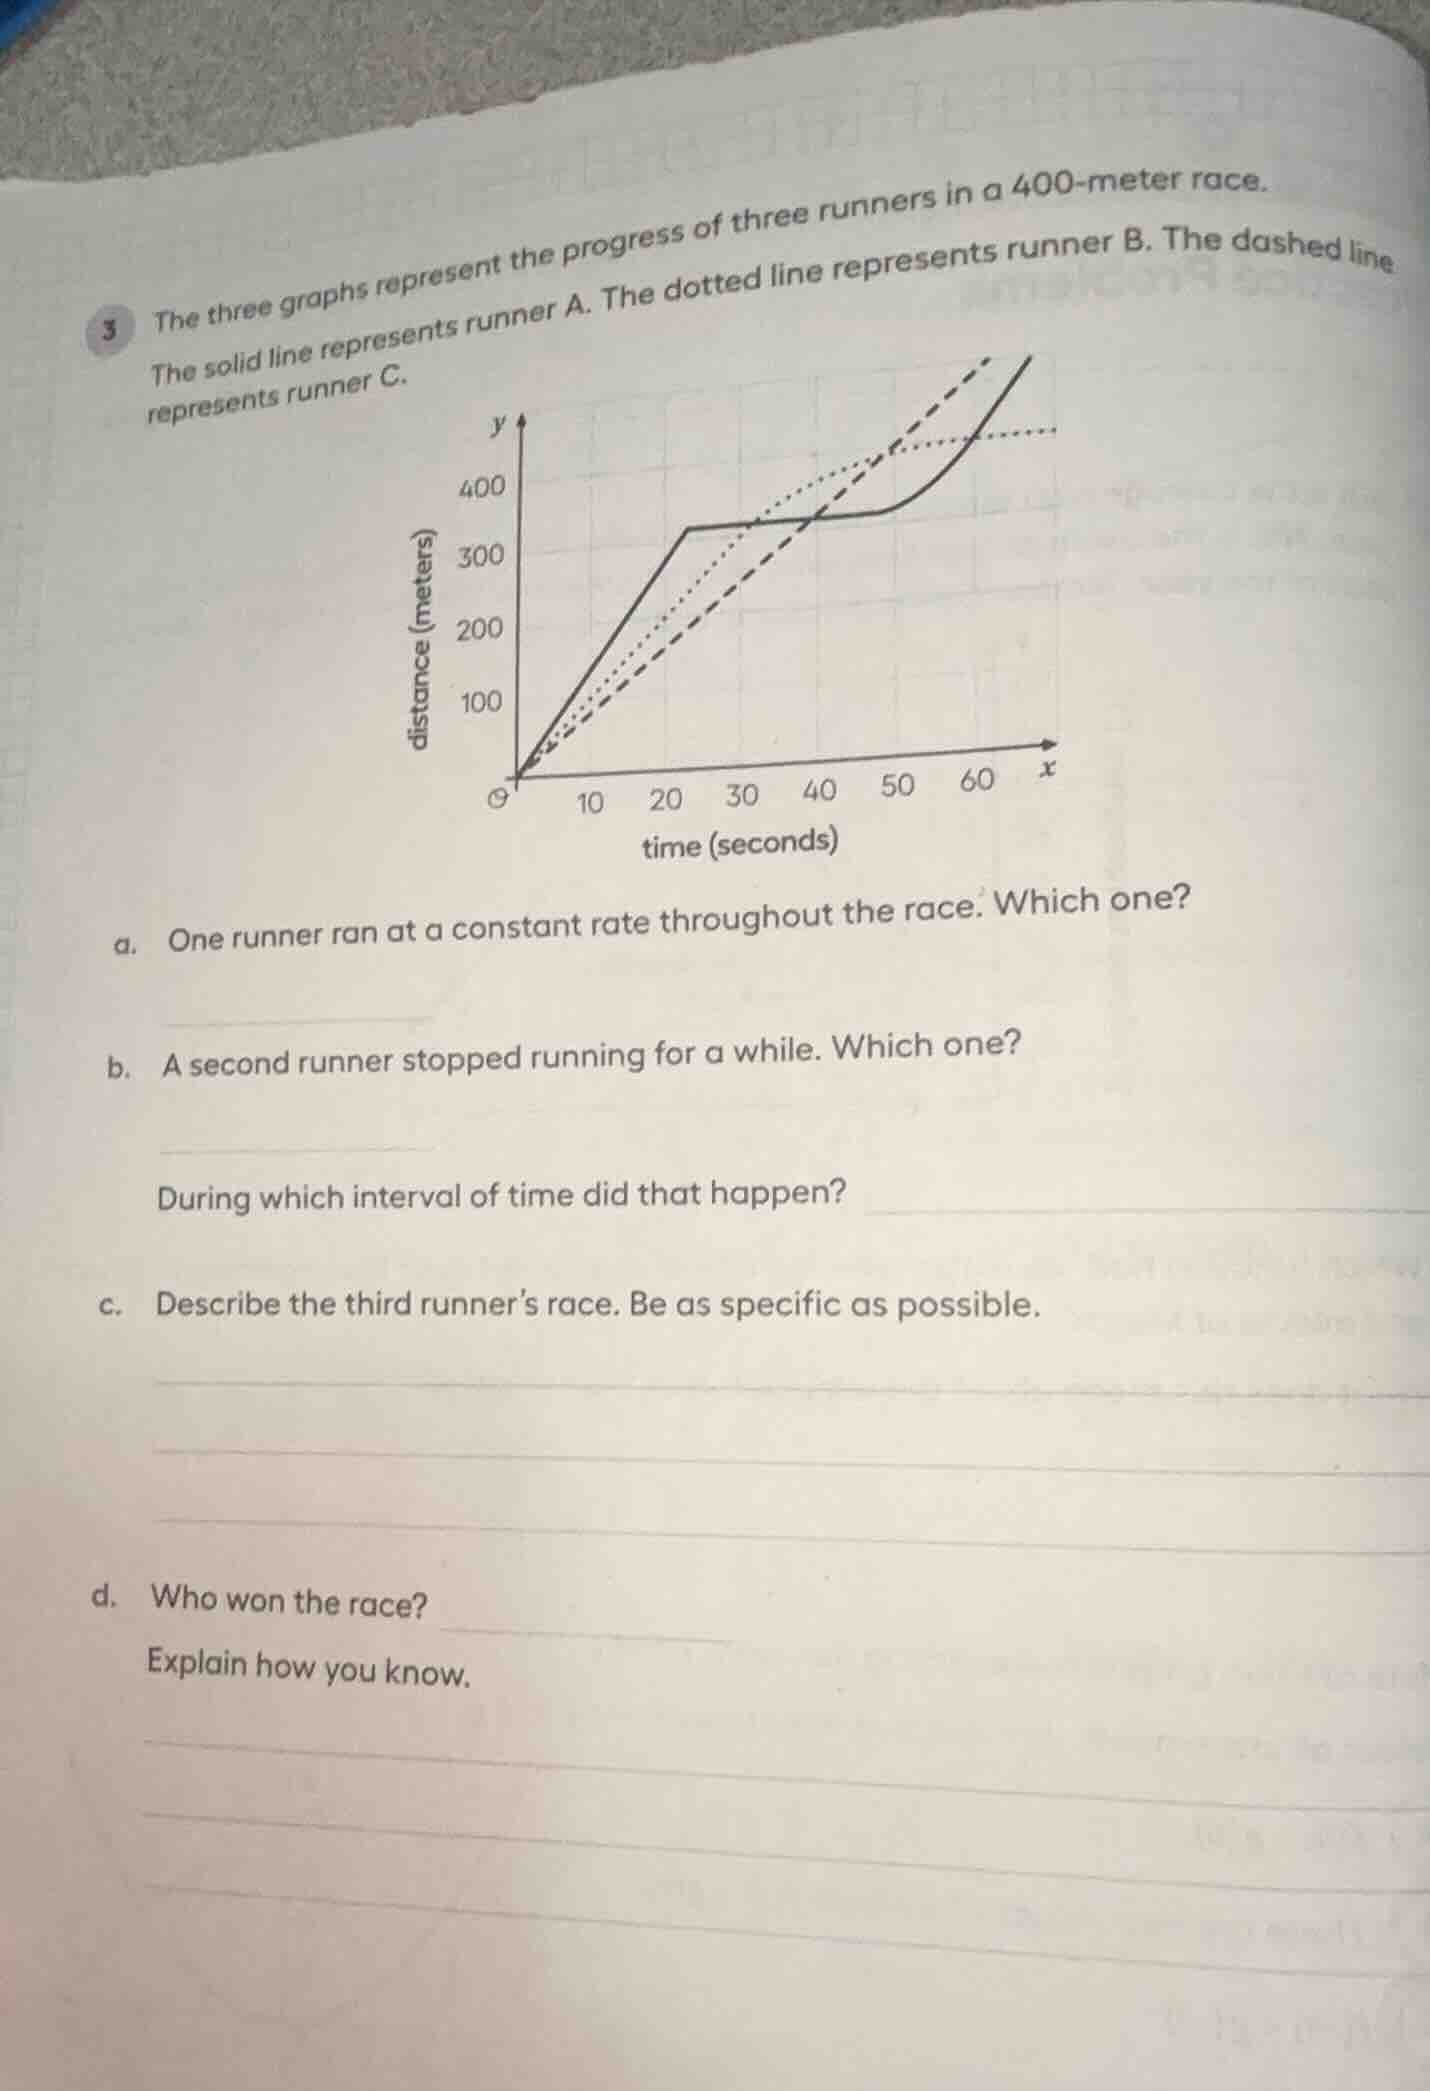
3 the three graphs represent the progress of three runners in a 400 - meter race. the solid line represents runner a. the dotted line represents runner b. the dashed line represents runner c.
a. one runner ran at a constant rate throughout the race. which one?
b. a second runner stopped running for a while. which one?
during which interval of time did that happen?
c. describe the third runner’s race. be as specific as possible.
d. who won the race?
explain how you know.
a. A constant rate means a straight line graph (constant slope, since speed = distance/time, slope = change in distance/change in time). Runner C's dashed line is straight throughout.
b. A stopped runner has no distance change over time, so the graph is horizontal. Runner A's solid line is flat between 20 and 50 seconds.
c. Runner B's dotted line: starts with increasing speed (positive slope), then the slope decreases later until distance stops increasing at ~450 meters (short of 400m? No, wait, the graph levels off before 400m, so they ran increasing speed first, then slowed to a stop before finishing the 400m race.
d. The winner is the runner who reaches 400 meters in the least time. Runner C's dashed line reaches 400 meters first, before runner A and before B (who never finished).

Snap & solve any problem in the app
Get step-by-step solutions on Sovi AI
Photo-based solutions with guided steps
Explore more problems and detailed explanations
a. Runner C
b. Runner A; 20 to 50 seconds
c. Runner B ran at an increasing speed (gradually faster pace) for the first part of the race, then slowed down and stopped before completing the full 400 meters, ending at a distance shorter than 400 meters.
d. Runner C won the race. Runner C's graph reaches the 400-meter distance in less time than Runner A, and Runner B did not complete the 400-meter race (their distance stopped increasing before reaching 400 meters).