QUESTION IMAGE
Question
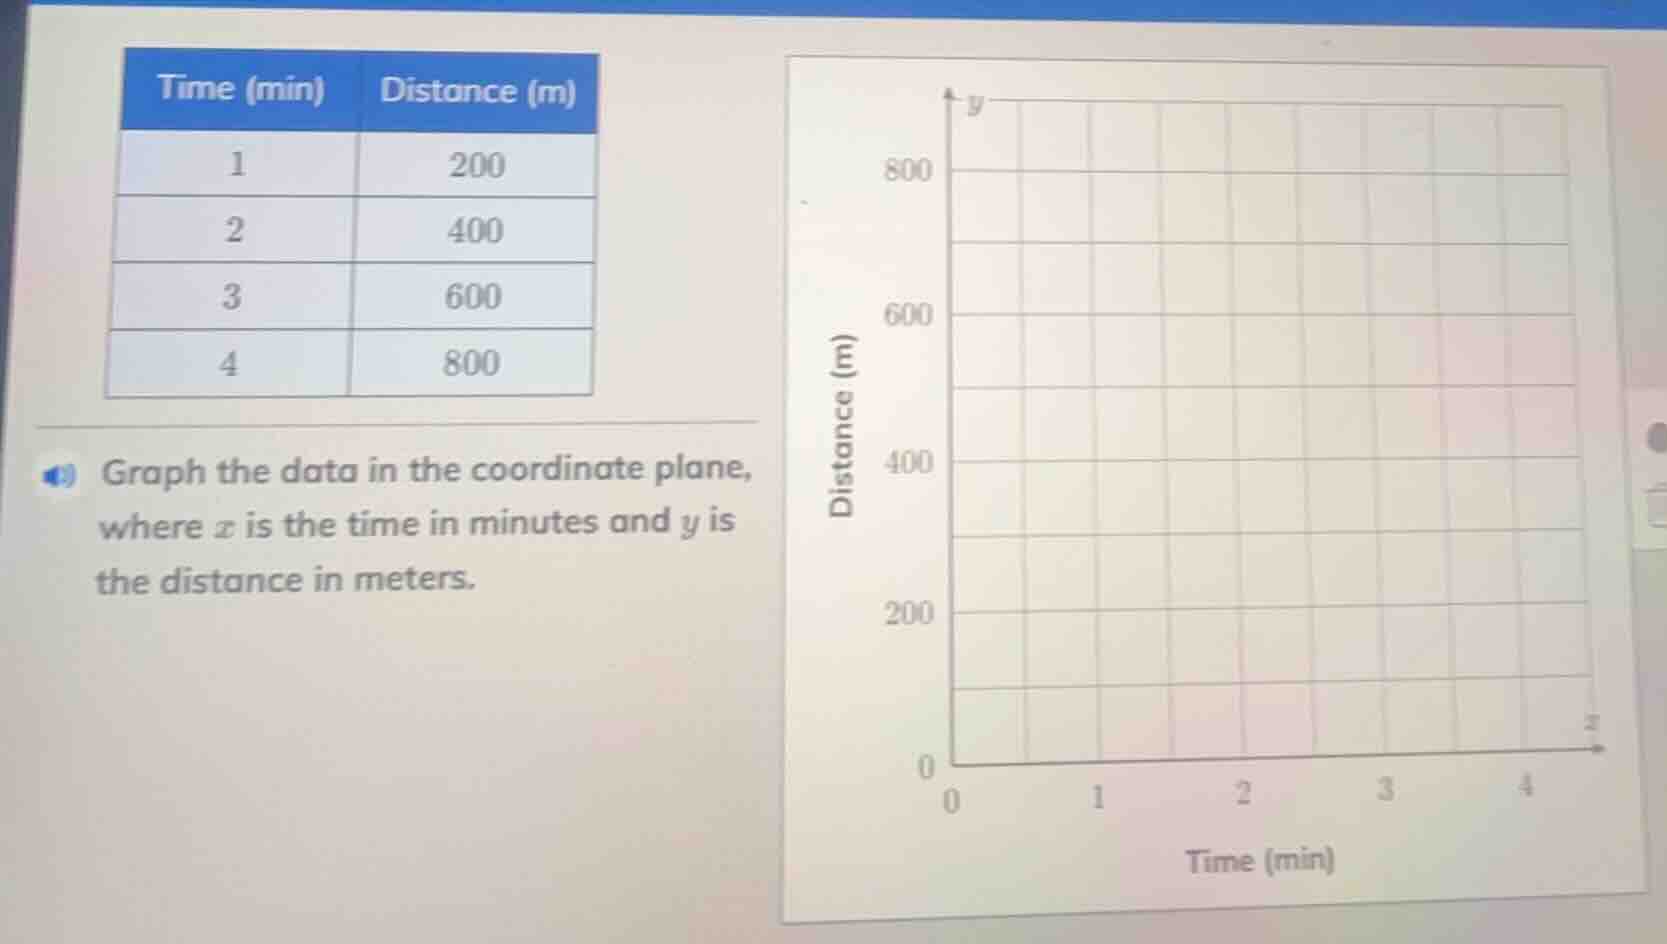
time (min) distance (m) 1 200 2 400 3 600 4 800 graph the data in the coordinate plane, where x is the time in minutes and y is the distance in meters.
Step1: Identify data points
From the table, the points are (1, 200), (2, 400), (3, 600), (4, 800).
Step2: Plot each point
- For \( x = 1 \), \( y = 200 \): Locate \( x = 1 \) on the x - axis and \( y = 200 \) on the y - axis, mark the point.
- For \( x = 2 \), \( y = 400 \): Locate \( x = 2 \) on the x - axis and \( y = 400 \) on the y - axis, mark the point.
- For \( x = 3 \), \( y = 600 \): Locate \( x = 3 \) on the x - axis and \( y = 600 \) on the y - axis, mark the point.
- For \( x = 4 \), \( y = 800 \): Locate \( x = 4 \) on the x - axis and \( y = 800 \) on the y - axis, mark the point.
Step3: Connect the points (optional for a scatter plot, but since it's a linear relationship, we can also draw a line through them)
The points lie on a straight line with a slope of \( \frac{400 - 200}{2 - 1}=200 \), so we can connect them to show the linear relationship between time and distance.
(Note: Since the question is about graphing, the main steps are identifying the coordinates from the table and plotting them on the given coordinate plane. The final "answer" in terms of the graph would be the plotted points (1, 200), (2, 400), (3, 600), (4, 800) on the coordinate plane with x as time (min) and y as distance (m).)

Snap & solve any problem in the app
Get step-by-step solutions on Sovi AI
Photo-based solutions with guided steps
Explore more problems and detailed explanations
The data points \((1, 200)\), \((2, 400)\), \((3, 600)\), and \((4, 800)\) are plotted on the coordinate plane where the x - axis represents time (in minutes) and the y - axis represents distance (in meters). A line can be drawn through these points to represent the linear relationship between time and distance.