QUESTION IMAGE
Question
try it
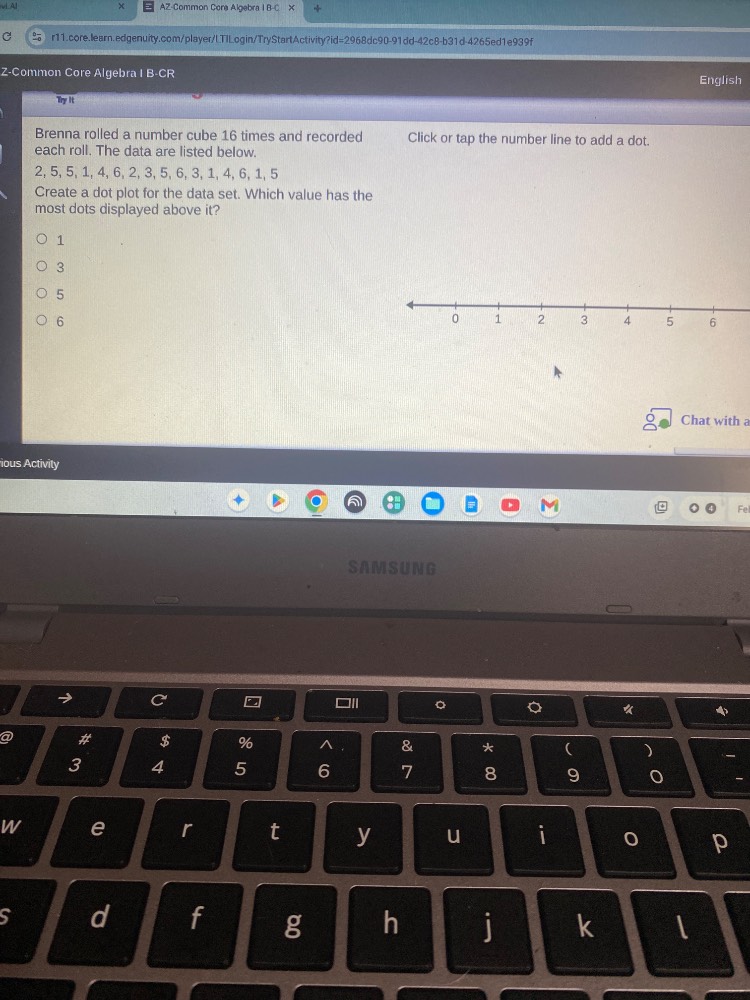
brenna rolled a number cube 16 times and recorded each roll. the data are listed below.
2, 5, 5, 1, 4, 6, 2, 3, 5, 6, 3, 1, 4, 6, 1, 5
create a dot plot for the data set. which value has the most dots displayed above it?
○ 1
○ 3
○ 5
○ 6
click or tap the number line to add a dot.
Step1: Count frequency of each value
Count occurrences of 1,3,5,6:
- 1: appears in positions 4, 10, 13 → 3 times
- 3: appears in positions 7, 12 → 2 times
- 5: appears in positions 2,3,8,16 → 4 times
- 6: appears in positions 6,9 → 2 times
Step2: Identify highest frequency
Compare counts: 4 > 3 > 2

Snap & solve any problem in the app
Get step-by-step solutions on Sovi AI
Photo-based solutions with guided steps
Explore more problems and detailed explanations
5