QUESTION IMAGE
Question
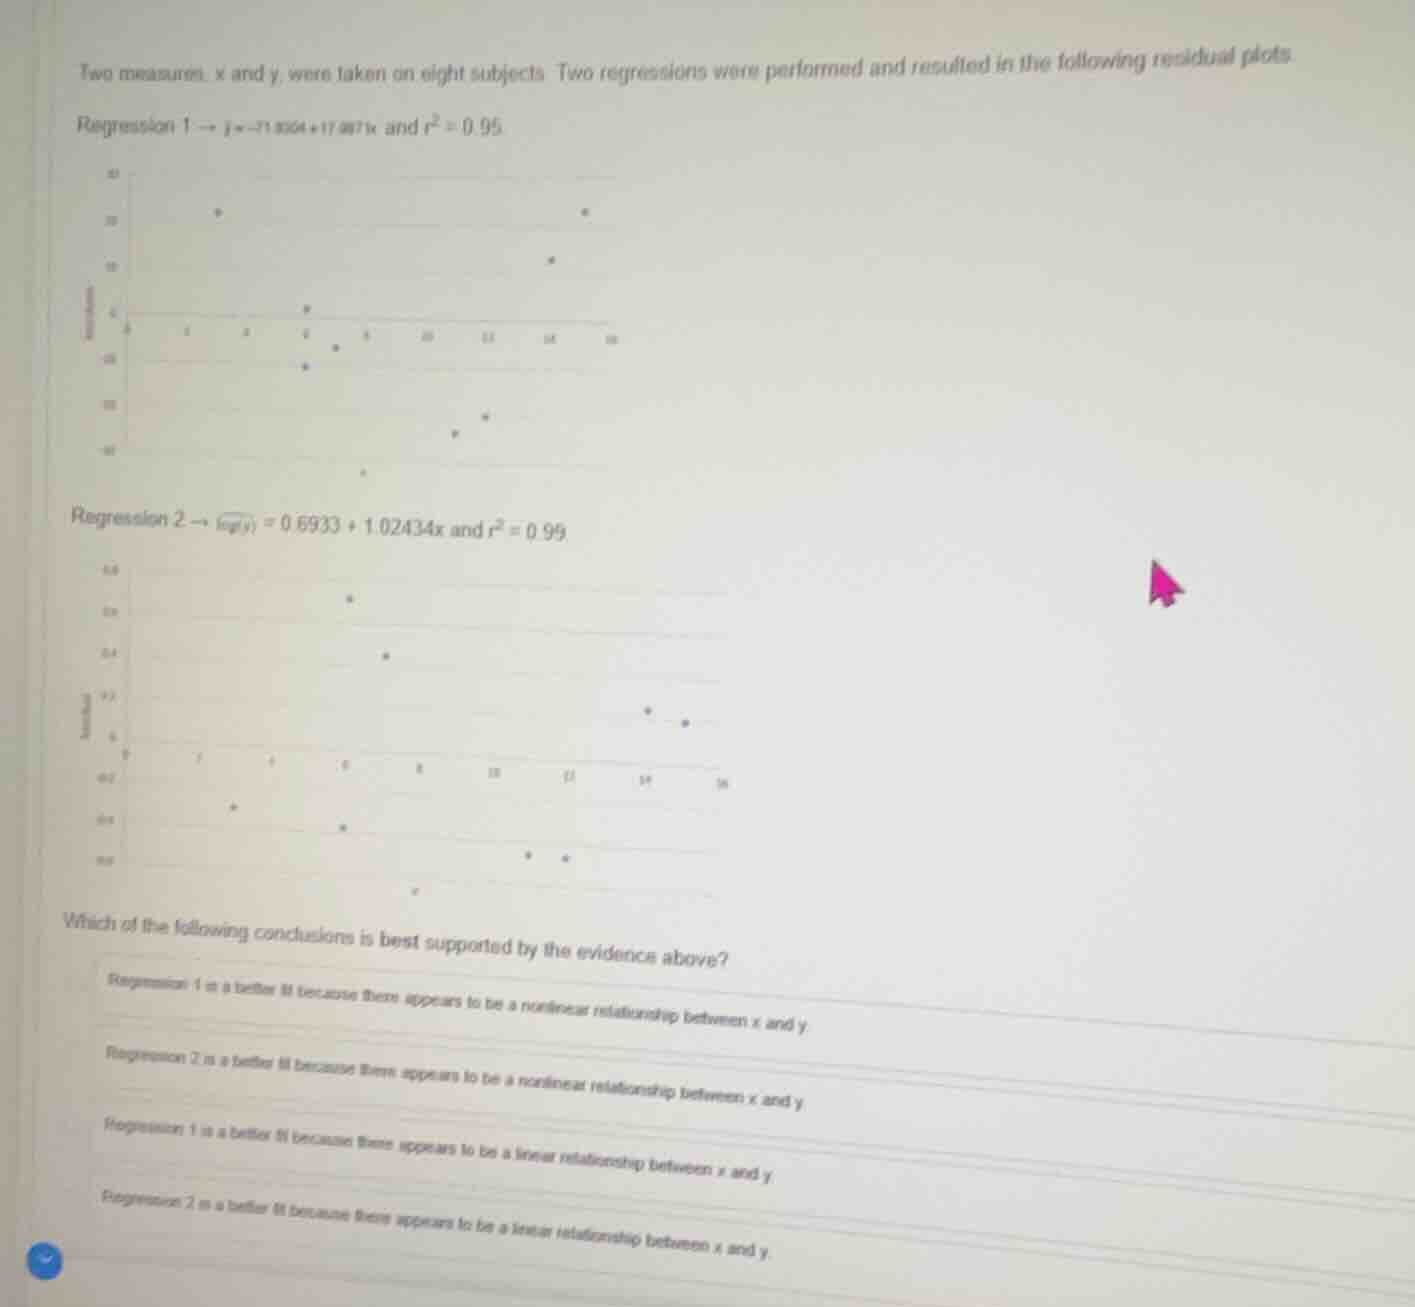
two measures, x and y, were taken on eight subjects. two regressions were performed and resulted in the following residual plots.regression 1 → $hat{y}=-71.804 + 17.987x$ and $r^2 = 0.95$regression 2 → $log(hat{y}) = 0.6933 + 1.02434x$ and $r^2 = 0.99$which of the following conclusions is best supported by the evidence above?regression 1 is a better fit because there appears to be a nonlinear relationship between x and yregression 2 is a better fit because there appears to be a nonlinear relationship between x and yregression 1 is a better fit because there appears to be a linear relationship between x and yregression 2 is a better fit because there appears to be a linear relationship between x and y
- Analyze Residual Plot 1: The residuals form a clear curved (U-shaped) pattern, which indicates that a linear model (Regression 1) is not appropriate, as the relationship between x and y is nonlinear.
- Analyze Residual Plot 2: The residuals are randomly scattered around 0 with no obvious pattern, which means the transformed model (Regression 2, using log(y)) accounts for the nonlinear relationship between x and y, making it a better fit.
- Match to options: The correct reasoning is that Regression 2 is better because the residual plots show the original relationship between x and y is nonlinear, which the transformed model addresses.

Snap & solve any problem in the app
Get step-by-step solutions on Sovi AI
Photo-based solutions with guided steps
Explore more problems and detailed explanations
Regression 2 is a better fit because there appears to be a nonlinear relationship between x and y