QUESTION IMAGE
Question
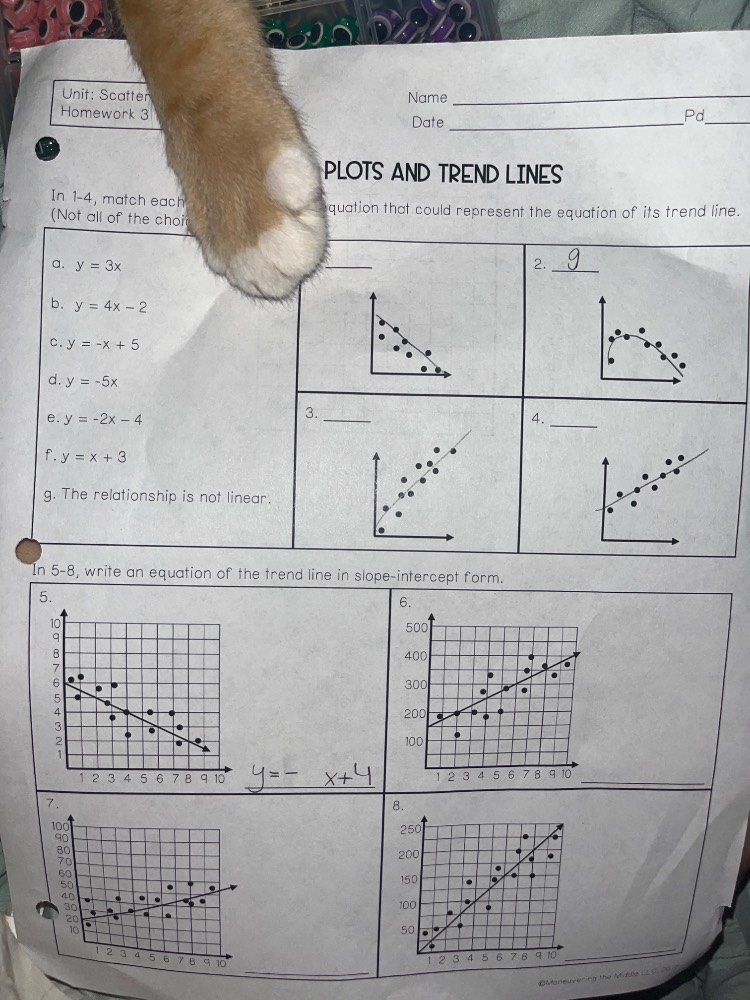
unit: scatterhomework 3name _____________date ___________ pd __plots and trend linesin 1-4, match each scatter plot with an equation that could represent the equation of its trend line.(not all of the choices will be used.)a. $y = 3x$b. $y = 4x - 2$c. $y = -x + 5$d. $y = -5x$e. $y = -2x - 4$f. $y = x + 3$g. the relationship is not linear.1. __2. $g$3. __4. ____in 5-8, write an equation of the trend line in slope-intercept form.5.6.7.8.
Step1: Match Graph 1 to equation
Graph 1 has a negative slope, y-intercept positive. Equation: $y=-x+5$
Step2: Match Graph 2 to description
Graph 2 is curved, not linear. Choice: g
Step3: Match Graph 3 to equation
Graph 3 has positive slope, y-intercept 0. Equation: $y=3x$
Step4: Match Graph 4 to equation
Graph 4 has positive slope, positive y-intercept. Equation: $y=x+3$
Step5: Find trend line for Q5
Pick points (0,7) and (10,1). Slope: $\frac{1-7}{10-0}=-1$. Equation: $y=-x+7$
Step6: Find trend line for Q6
Pick points (0,150) and (10,400). Slope: $\frac{400-150}{10-0}=25$. Equation: $y=25x+150$
Step7: Find trend line for Q7
Pick points (0,20) and (10,50). Slope: $\frac{50-20}{10-0}=3$. Equation: $y=3x+20$
Step8: Find trend line for Q8
Pick points (0,0) and (10,250). Slope: $\frac{250-0}{10-0}=25$. Equation: $y=25x$

Snap & solve any problem in the app
Get step-by-step solutions on Sovi AI
Photo-based solutions with guided steps
Explore more problems and detailed explanations
- c
- g. The relationship is not linear.
- a
- f
- $y=-x+7$
- $y=25x+150$
- $y=3x+20$
- $y=25x$