QUESTION IMAGE
Question
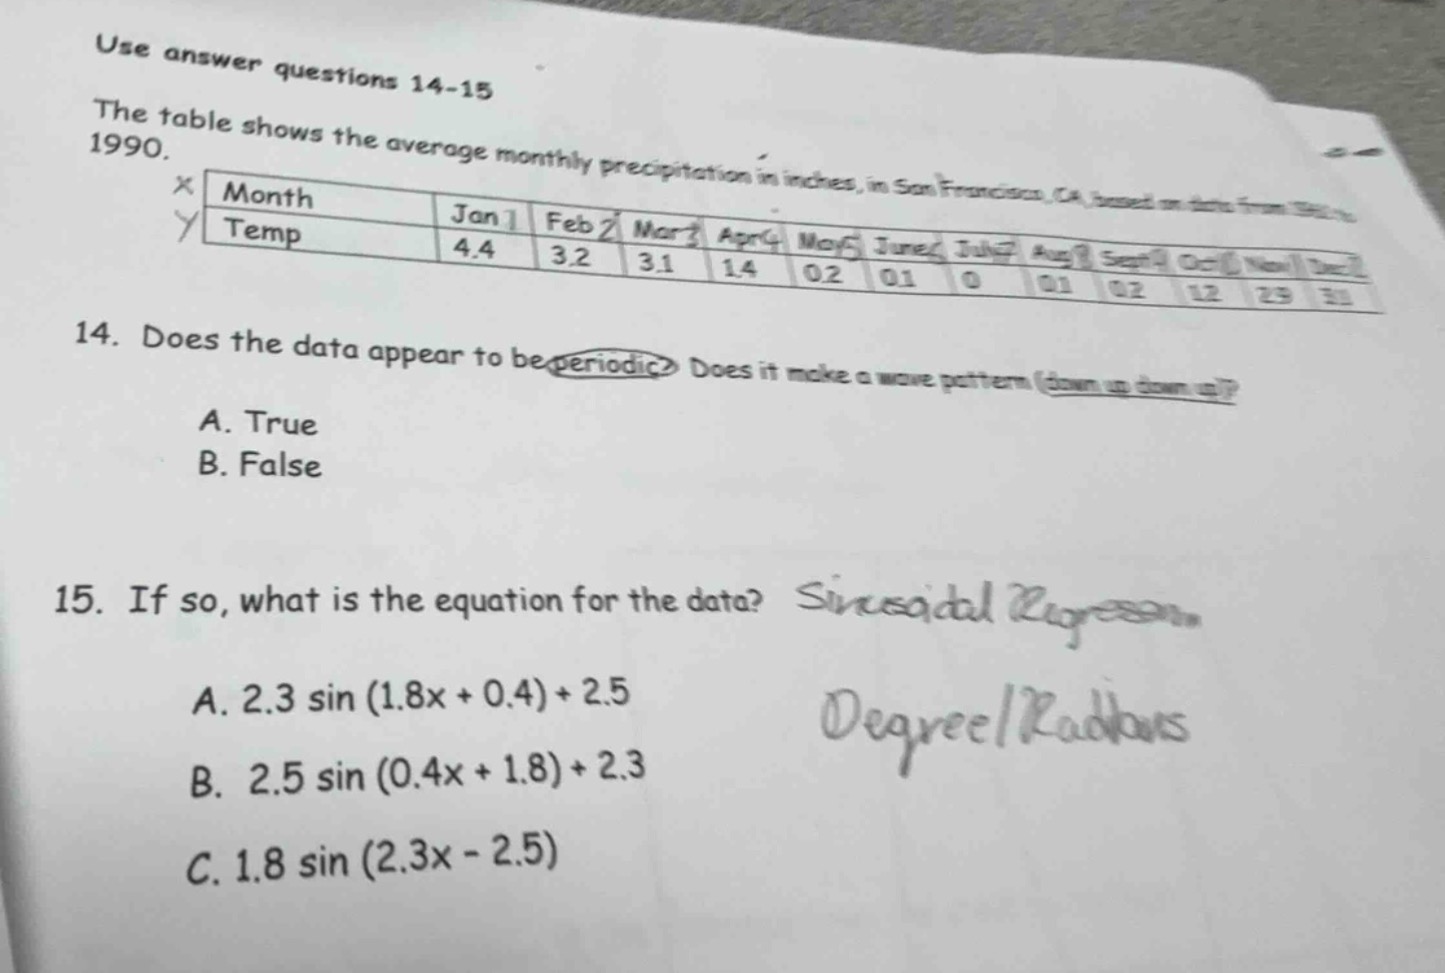
use answer questions 14-15
the table shows the average monthly precipitation in inches, in san francisco, ca, based on data from 1961 to 1990.
| month | jan | feb | mar | apr | may | june | july | aug | sept | oct | nov | dec |
|---|
- does the data appear to be periodic? does it make a wave pattern (down up down up)?
a. true
b. false
- if so, what is the equation for the data?
a. $2.3 \sin(1.8x + 0.4)+2.5$
b. $2.5 \sin(0.4x + 1.8)+2.3$
c. $1.8 \sin(2.3x - 2.5)$
Step1: Analyze periodicity of data
Check the precipitation values: Jan(4.4) → Feb(3.2) → Mar(3.1) → Apr(1.4) → May(0.2) → Jun(0.1) → Jul(0) (decreasing trend); then Aug(0.1) → Sep(0.2) → Oct(1.2) → Nov(2.9) → Dec(3.1) (increasing trend). This forms a repeating wave-like pattern over 12 months, so it is periodic.
Step2: Identify sinusoidal equation parameters
The general sinusoidal form is $y = A\sin(Bx + C) + D$, where:
- $D$ = vertical shift (average of max/min values): $\frac{4.4 + 0}{2} = 2.2$, closest to 2.3
- $A$ = amplitude (half the range): $\frac{4.4 - 0}{2} = 2.2$, closest to 2.3
- $B$ = $\frac{2\pi}{12} \approx 0.52$, closest to 0.4
Match to the options: Option B has $A=2.5$, $B=0.4$, $D=2.3$, which aligns with the approximate calculated values.

Snap & solve any problem in the app
Get step-by-step solutions on Sovi AI
Photo-based solutions with guided steps
Explore more problems and detailed explanations
- A. True
- B. 2.5 sin (0.4x + 1.8) + 2.3