QUESTION IMAGE
Question
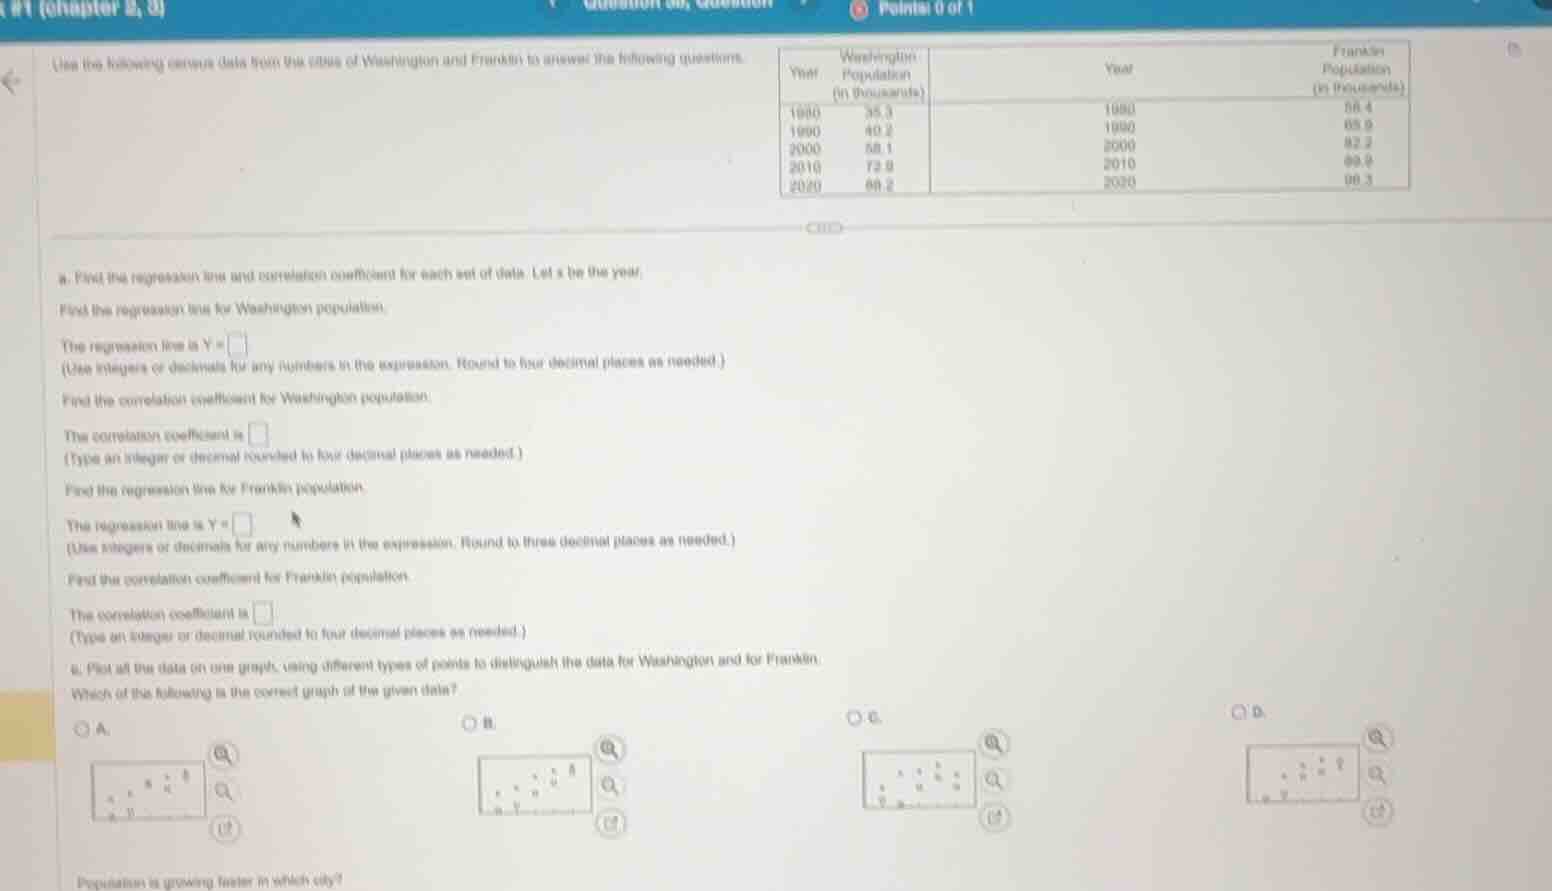
use the following census data from the cities of washington and franklin to answer the following questions.
washington:
year | population (in thousands)
1980 | 36.3
1990 | 43.2
2000 | 58.1
2010 | 72.8
2020 | 88.2
franklin:
year | population (in thousands)
1980 | 16.4
1990 | 65.9
2000 | 82.2
2010 | 99.9
2030 | 99.3
a. find the regression line and correlation coefficient for each set of data. let x be the year.
find the regression line for washingtons population.
the regression line is y =
(use integers or decimals for any numbers in the expression. round to four decimal places as needed.)
find the correlation coefficient for washingtons population.
the correlation coefficient is
(type an integer or decimal rounded to four decimal places as needed.)
find the regression line for franklins population.
the regression line is y =
(use integers or decimals for any numbers in the expression. round to three decimal places as needed.)
find the correlation coefficient for franklins population.
the correlation coefficient is
(type an integer or decimal rounded to four decimal places as needed.)
b. plot all the data on one graph, using different types of points to distinguish the data for washington and for franklin.
which of the following is the correct graph of the given data?
○ a.
○ b.
○ c.
○ d.
population is growing faster in which city?
Step1: Define variables for Washington
Let $x$ = year, $y$ = population (thousands).
Data points: $(1980, 35.3), (1990, 40.2), (2000, 58.1), (2010, 73.9), (2020, 88.2)$
Simplify $x$: let $x' = x - 2000$, so $x'$ values: $-20, -10, 0, 10, 20$
Step2: Calculate regression for Washington
First compute means:
$\bar{x}' = \frac{-20-10+0+10+20}{5} = 0$
$\bar{y} = \frac{35.3+40.2+58.1+73.9+88.2}{5} = 59.14$
Slope $m = \frac{\sum(x'_i - \bar{x}')(y_i - \bar{y})}{\sum(x'_i - \bar{x}')^2} = \frac{(-20)(-23.84)+(-10)(-18.94)+0+10(14.76)+20(29.06)}{400+100+0+100+400}$
$= \frac{476.8+189.4+0+147.6+581.2}{1000} = \frac{1395}{1000} = 1.3950$
Intercept $b = \bar{y} - m\bar{x}' = 59.14$
Substitute back $x' = x - 2000$:
$y = 1.3950(x - 2000) + 59.14 = 1.3950x - 2790 + 59.14 = 1.3950x - 2730.8600$
Step3: Calculate correlation for Washington
$r = \frac{\sum(x'_i - \bar{x}')(y_i - \bar{y})}{\sqrt{\sum(x'_i - \bar{x}')^2\sum(y_i - \bar{y})^2}}$
$\sum(y_i - \bar{y})^2 = (-23.84)^2+(-18.94)^2+(-1.04)^2+(14.76)^2+(29.06)^2 = 568.3456+358.7236+1.0816+217.8576+844.4836 = 1990.492$
$r = \frac{1395}{\sqrt{1000 \times 1990.492}} = \frac{1395}{\sqrt{1990492}} \approx \frac{1395}{1410.848} \approx 0.9888$
Step4: Define variables for Franklin
Data points: $(1980, 58.4), (1990, 65.9), (2000, 82.2), (2010, 99.9), (2020, 118.1)$
Use $x' = x - 2000$, so $x'$ values: $-20, -10, 0, 10, 20$
Step5: Calculate regression for Franklin
$\bar{y} = \frac{58.4+65.9+82.2+99.9+118.1}{5} = 84.9$
Slope $m = \frac{(-20)(-26.5)+(-10)(-19)+0+10(15)+20(33.2)}{1000}$
$= \frac{530+190+0+150+664}{1000} = \frac{1534}{1000} = 1.534$
Intercept $b = 84.9$
Substitute back $x' = x - 2000$:
$y = 1.534(x - 2000) + 84.9 = 1.534x - 3068 + 84.9 = 1.534x - 2983.100$
Step6: Calculate correlation for Franklin
$\sum(y_i - \bar{y})^2 = (-26.5)^2+(-19)^2+(-2.7)^2+(15)^2+(33.2)^2 = 702.25+361+7.29+225+1102.24 = 2397.78$
$r = \frac{1534}{\sqrt{1000 \times 2397.78}} = \frac{1534}{\sqrt{2397780}} \approx \frac{1534}{1548.476} \approx 0.9907$
Step7: Analyze growth rate
Compare slopes: Franklin's slope (1.534) > Washington's slope (1.3950), so Franklin grows faster.
For the graph: Washington points are (1980,35.3), (1990,40.2), (2000,58.1), (2010,73.9), (2020,88.2); Franklin points are (1980,58.4), (1990,65.9), (2000,82.2), (2010,99.9), (2020,118.1). Franklin's points are always higher, and both increase linearly.

Snap & solve any problem in the app
Get step-by-step solutions on Sovi AI
Photo-based solutions with guided steps
Explore more problems and detailed explanations
Part a:
- Washington regression line: $Y = 1.3950x - 2730.8600$
- Washington correlation coefficient: $0.9888$
- Franklin regression line: $Y = 1.534x - 2983.100$
- Franklin correlation coefficient: $0.9907$
Part b:
- Correct graph: The option with two increasing sets of points where all Franklin points lie above Washington points (matches the data trend)
- Faster growing city: Franklin