QUESTION IMAGE
Question
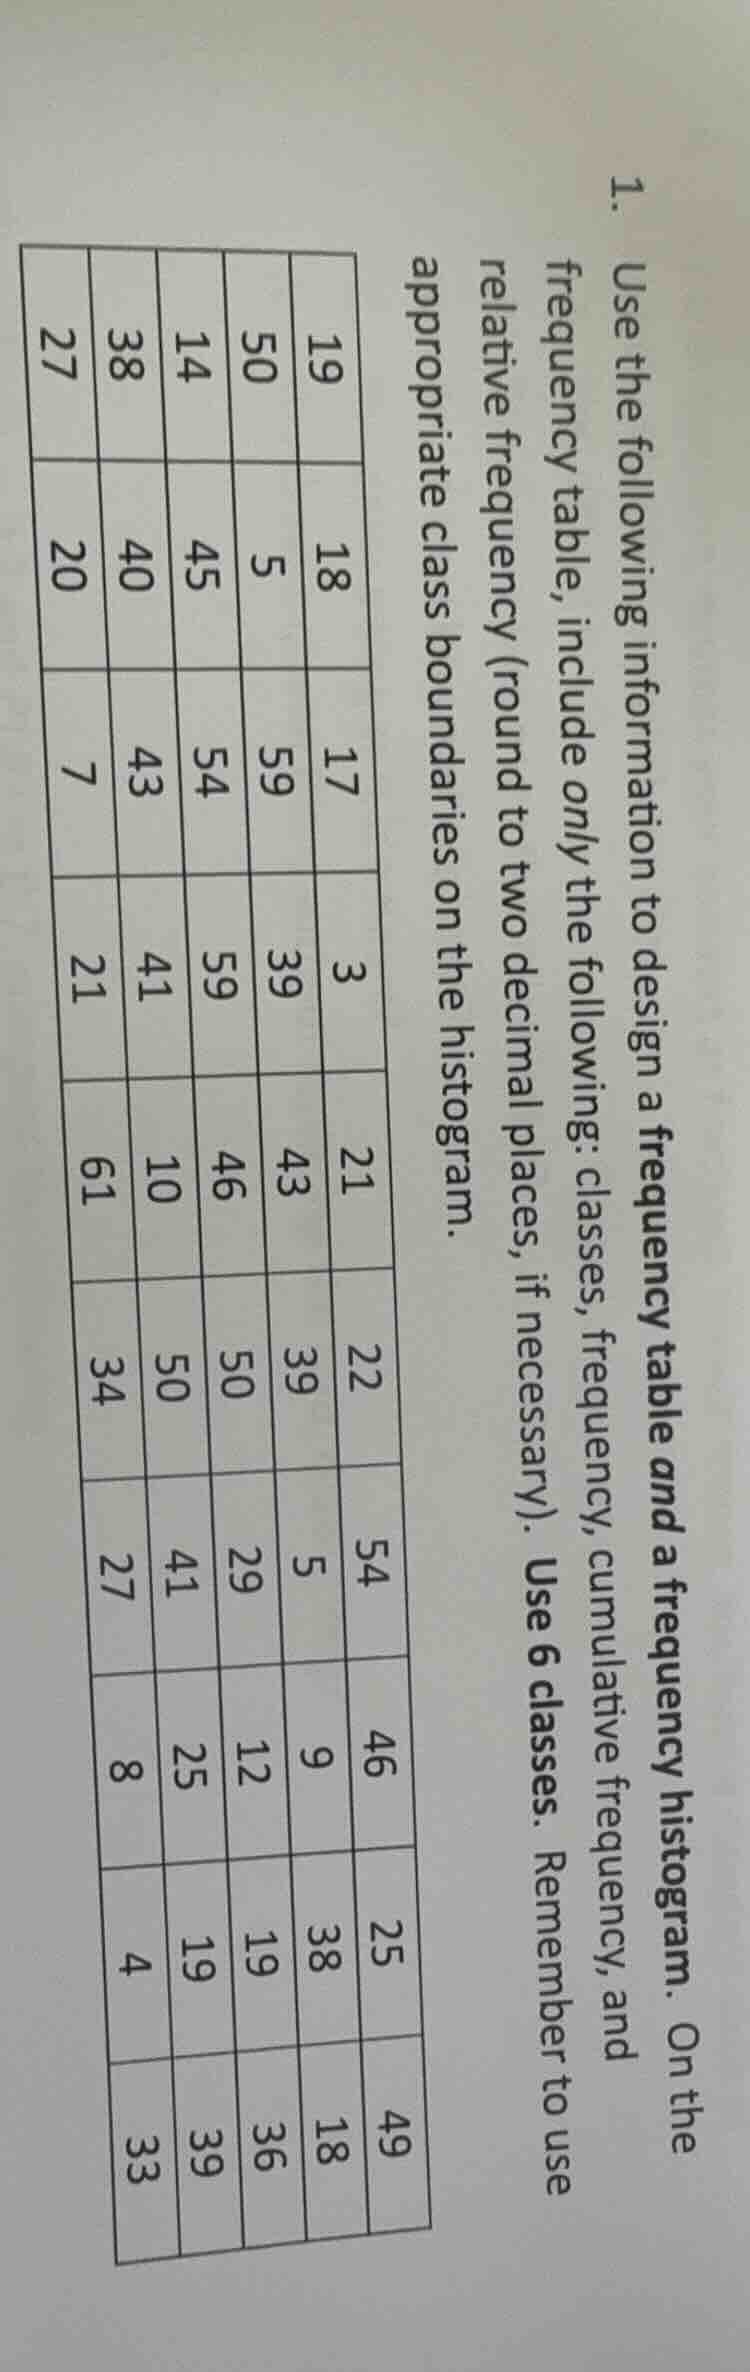
- use the following information to design a frequency table and a frequency histogram. on the frequency table, include only the following: classes, frequency, cumulative frequency, and relative frequency (round to two decimal places, if necessary). use 6 classes. remember to use appropriate class boundaries on the histogram.
19 18 17 3 21 22 54 46 25 49
50 5 59 39 43 39 5 9 38 18
14 45 54 59 46 50 29 12 19 36
38 40 43 41 10 50 41 25 19 39
27 20 7 21 61 34 27 8 4 33
Step1: Find min, max, class width
First, identify the minimum value ($3$) and maximum value ($61$) in the dataset. Calculate class width:
$$\text{Class Width} = \frac{\text{Max} - \text{Min}}{\text{Number of Classes}} = \frac{61 - 3}{6} \approx 9.67 \approx 10$$
Step2: Define class boundaries
Set classes with width 10, using appropriate boundaries to avoid gaps:
- $2.5 - 12.5$
- $12.5 - 22.5$
- $22.5 - 32.5$
- $32.5 - 42.5$
- $42.5 - 52.5$
- $52.5 - 62.5$
Step3: Tally frequencies
Count data points in each class:
- $2.5-12.5$: 3,5,5,7,8,9,10,12,14 → 9
- $12.5-22.5$: 17,18,18,19,19,20,21,21,22,25 → 10
- $22.5-32.5$: 27,27,29,33,34,36,38,38 → 8
- $32.5-42.5$: 39,39,39,40,41,41,43,43 → 8
- $42.5-52.5$: 45,46,46,49,50,50,50 → 7
- $52.5-62.5$: 54,54,59,59,61 → 5
Total data points: $9+10+8+8+7+5=47$
Step4: Calculate cumulative frequency
Sum frequencies sequentially:
- $2.5-12.5$: 9
- $12.5-22.5$: $9+10=19$
- $22.5-32.5$: $19+8=27$
- $32.5-42.5$: $27+8=35$
- $42.5-52.5$: $35+7=42$
- $52.5-62.5$: $42+5=47$
Step5: Calculate relative frequency
Divide each frequency by total ($n=47$), round to 2 decimals:
- $2.5-12.5$: $\frac{9}{47} \approx 0.19$
- $12.5-22.5$: $\frac{10}{47} \approx 0.21$
- $22.5-32.5$: $\frac{8}{47} \approx 0.17$
- $32.5-42.5$: $\frac{8}{47} \approx 0.17$
- $42.5-52.5$: $\frac{7}{47} \approx 0.15$
- $52.5-62.5$: $\frac{5}{47} \approx 0.11$

Snap & solve any problem in the app
Get step-by-step solutions on Sovi AI
Photo-based solutions with guided steps
Explore more problems and detailed explanations
Frequency Table
| Class Boundaries | Frequency | Cumulative Frequency | Relative Frequency |
|---|---|---|---|
| $12.5 - 22.5$ | 10 | 19 | 0.21 |
| $22.5 - 32.5$ | 8 | 27 | 0.17 |
| $32.5 - 42.5$ | 8 | 35 | 0.17 |
| $42.5 - 52.5$ | 7 | 42 | 0.15 |
| $52.5 - 62.5$ | 5 | 47 | 0.11 |
Histogram Notes:
- X-axis: Mark class boundaries ($2.5, 12.5, 22.5, 32.5, 42.5, 52.5, 62.5$)
- Y-axis: Frequency (scale from 0 to 10)
- Draw bars for each class with height equal to the class frequency, touching adjacent bars (no gaps between bars).