QUESTION IMAGE
Question
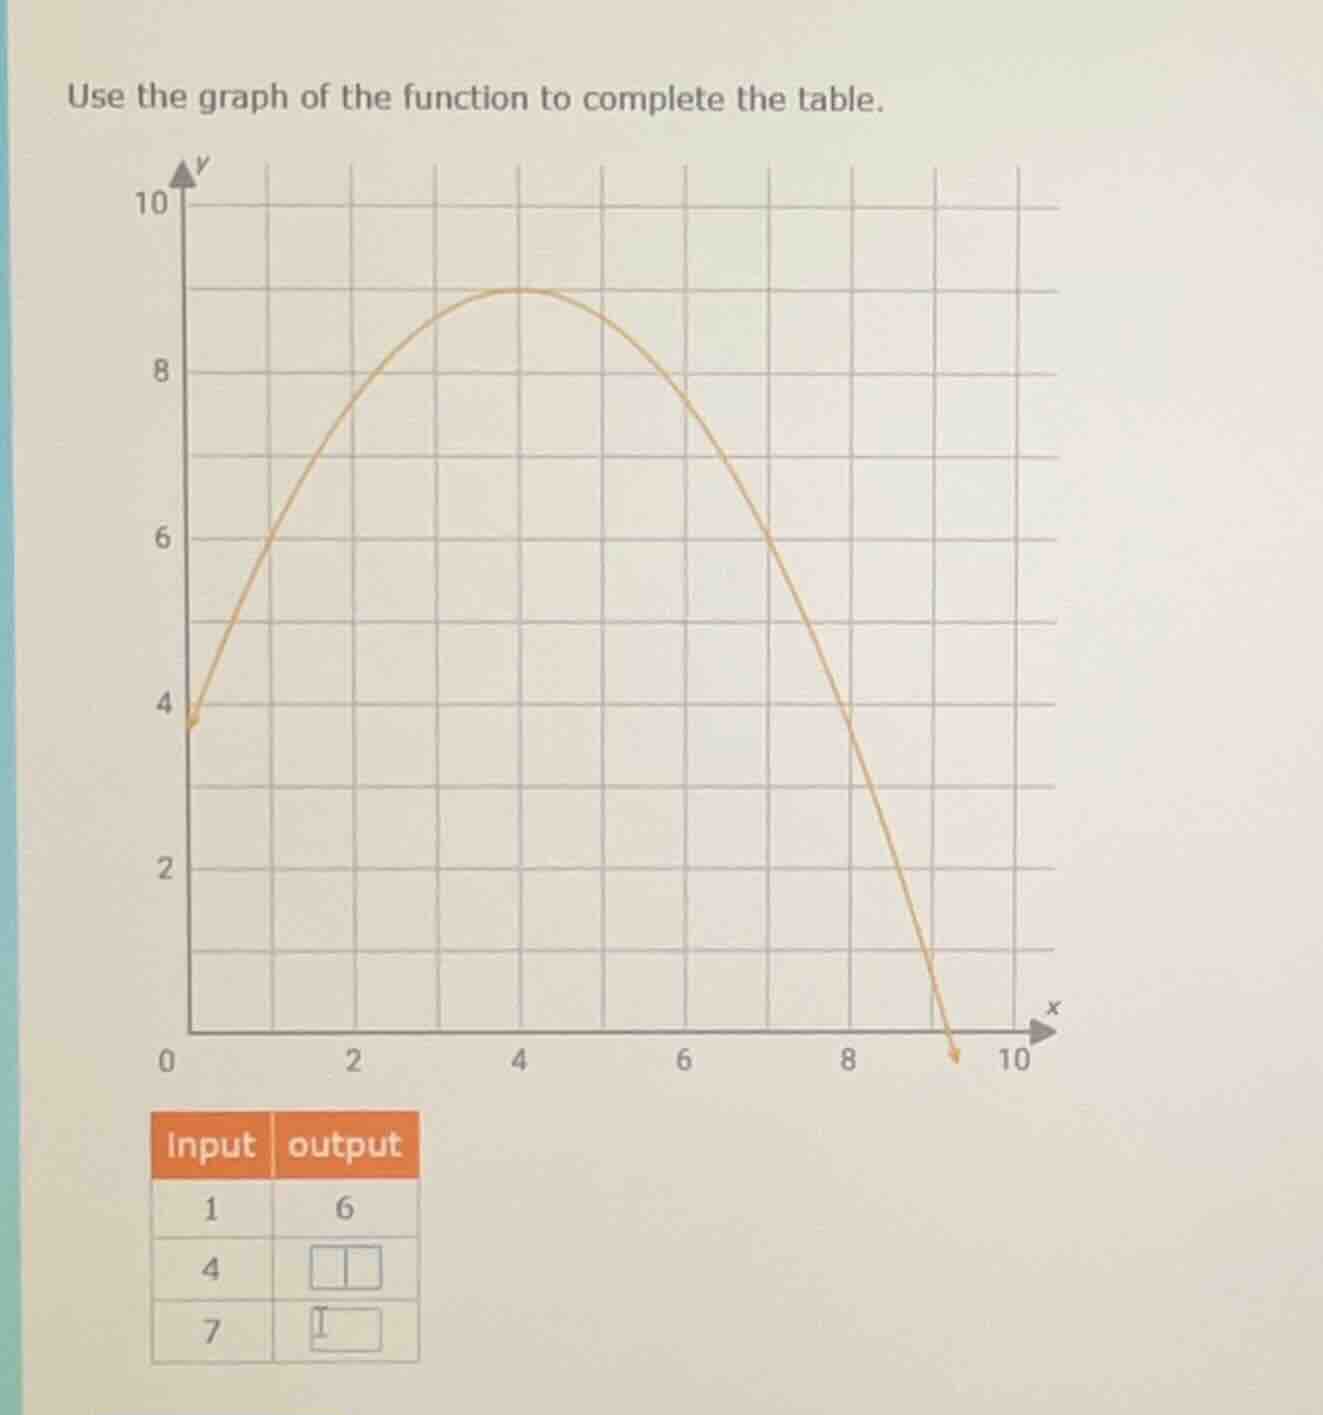
use the graph of the function to complete the table.
(graph of a parabola - y-axis from 0 to 10, x-axis from 0 to 10, passing through points like (0,4), peaking around x=4, then decreasing)
input | output
1 | 6
4 | blank
7 | blank
Step1: Find output for x=4
Locate $x=4$ on the x-axis, move up to the graph, the corresponding y-value is 9.
Step2: Find output for x=7
Locate $x=7$ on the x-axis, move up to the graph, the corresponding y-value is 6.

Snap & solve any problem in the app
Get step-by-step solutions on Sovi AI
Photo-based solutions with guided steps
Explore more problems and detailed explanations
| Input | output |
|---|---|
| 4 | 9 |
| 7 | 6 |