QUESTION IMAGE
Question
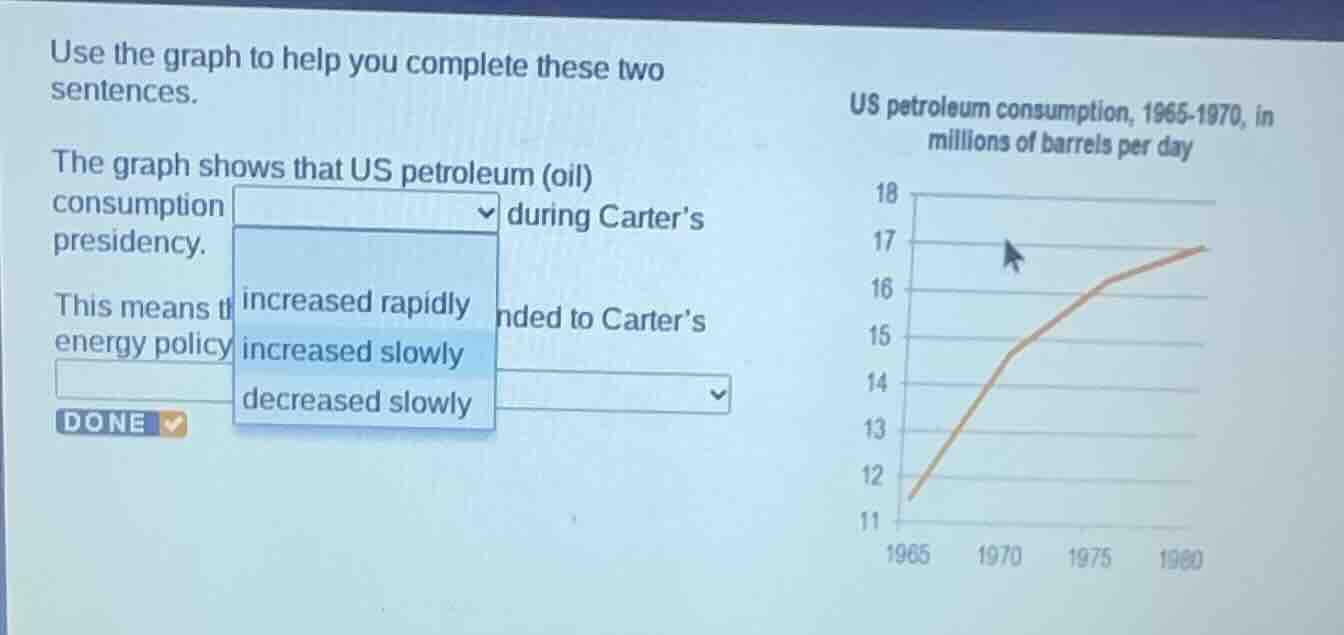
use the graph to help you complete these two sentences.
the graph shows that us petroleum (oil) consumption
during carter’s presidency.
this means t
nded to carter’s energy policy
us petroleum consumption, 1965 - 1970, in millions of barrels per day
options for the first blank: increased rapidly, increased slowly, decreased slowly
Brief Explanations
- First, note Jimmy Carter was US president from 1977 to 1981, which falls within the 1975-1980 segment of the graph. This segment shows a steady, moderate upward slope, not a sharp spike.
- This slow upward trend means petroleum consumption increased slowly during his presidency, which relates to his energy policy context.

Snap & solve any problem in the app
Get step-by-step solutions on Sovi AI
Photo-based solutions with guided steps
Explore more problems and detailed explanations
- The graph shows that US petroleum (oil) consumption increased slowly during Carter's presidency.
- This means that Carter's energy policy was paired with a slow rise in petroleum consumption (the dropdown aligns with the first blank's conclusion of slow increase).