QUESTION IMAGE
Question
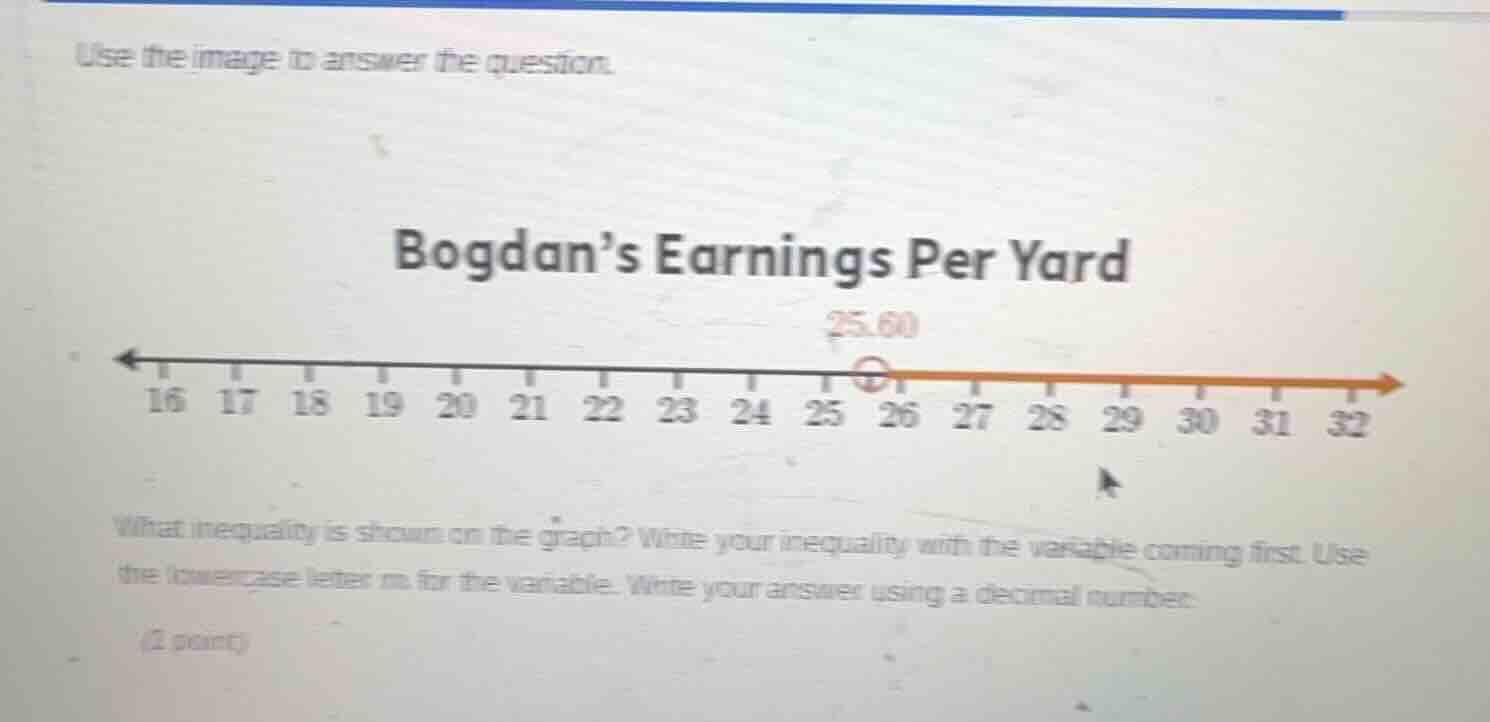
use the image to answer the question.
bogdan’s earnings per yard
what inequality is shown on the graph? write your inequality with the variable coming first. use the lowercase letter m for the variable. write your answer using a decimal number.
(2 point)
Step1: Analyze the number line marker
The graph has an open circle at 25.60, which means the value 25.60 is not included in the solution set.
Step2: Analyze the arrow direction
The arrow points to the right, indicating values greater than 25.60.
Step3: Write the inequality
Using variable $m$, the inequality represents values greater than 25.60.
$m > 25.60$

Snap & solve any problem in the app
Get step-by-step solutions on Sovi AI
Photo-based solutions with guided steps
Explore more problems and detailed explanations
$m > 25.60$