QUESTION IMAGE
Question
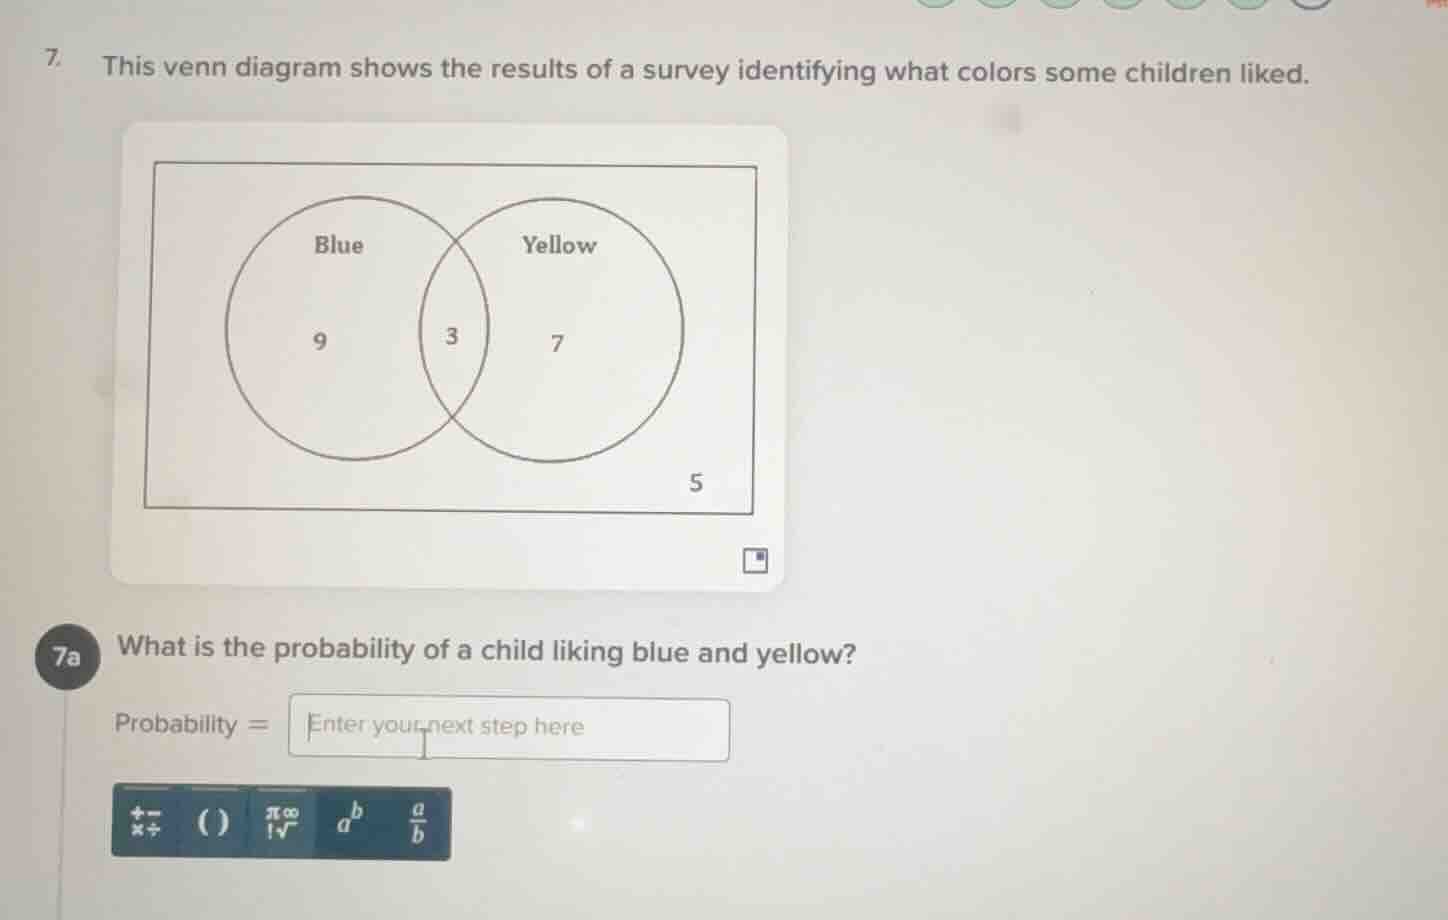
- this venn diagram shows the results of a survey identifying what colors some children liked. 7a what is the probability of a child liking blue and yellow? probability = enter your next step here
Step1: Find total number of children
To find the total number of children, we sum up all the regions in the Venn diagram: the part only in Blue (9), the part only in Yellow (7), the part in both (3), and the part in neither (5). So total \(= 9 + 3 + 7 + 5 = 24\).
Step2: Find number of children who like both blue and yellow
From the Venn diagram, the number of children who like both blue and yellow is 3.
Step3: Calculate probability
Probability is the number of favorable outcomes (children who like both) divided by the total number of outcomes (total children). So probability \(=\frac{3}{24}=\frac{1}{8}\).

Snap & solve any problem in the app
Get step-by-step solutions on Sovi AI
Photo-based solutions with guided steps
Explore more problems and detailed explanations
\(\frac{1}{8}\)