QUESTION IMAGE
Question
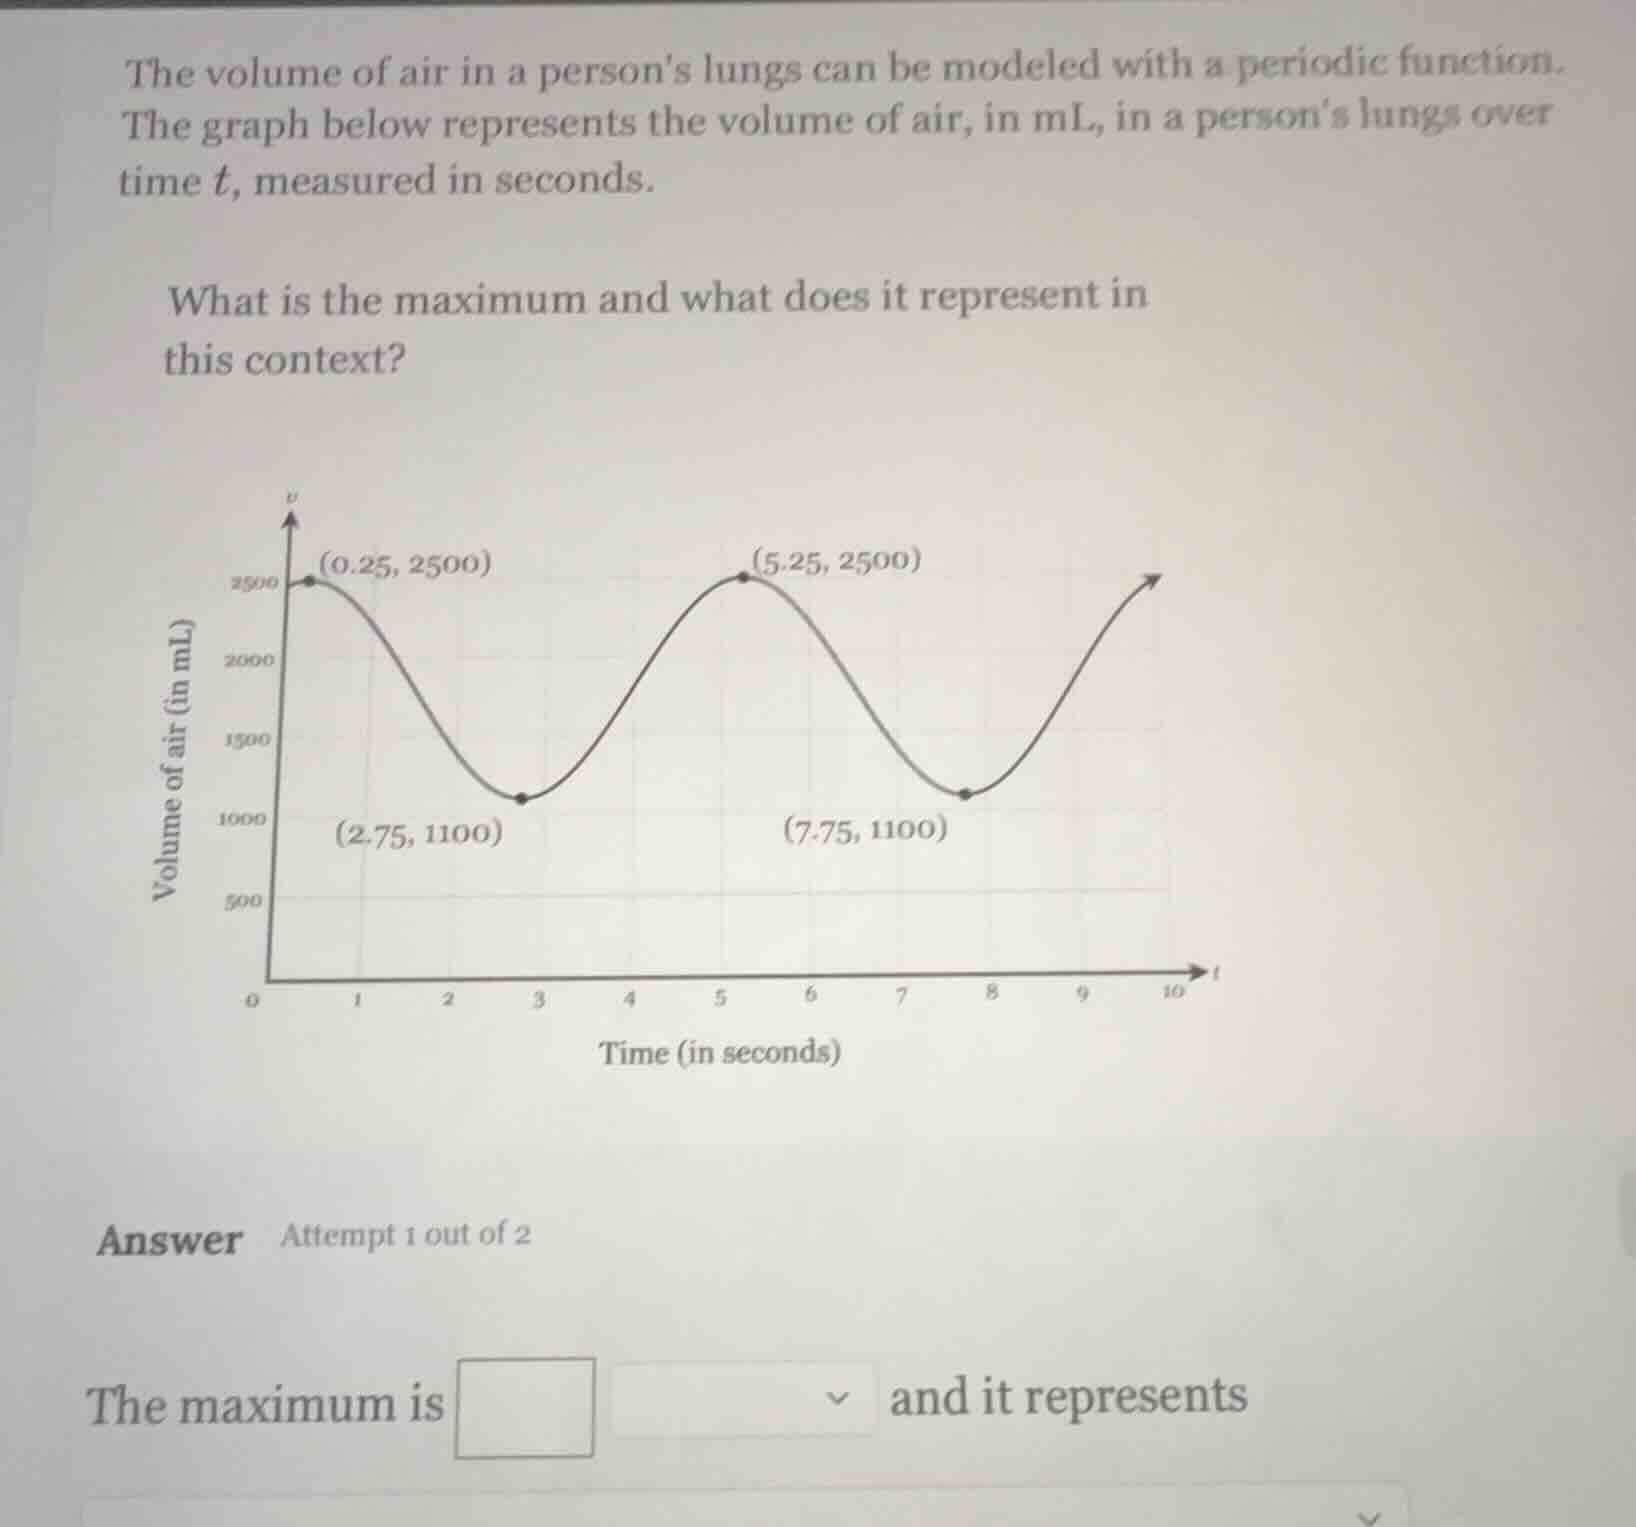
the volume of air in a persons lungs can be modeled with a periodic function. the graph below represents the volume of air, in ml, in a persons lungs over time ( t ), measured in seconds.
what is the maximum and what does it represent in this context?
(the graph shows volume of air (in ml) on the y - axis and time (in seconds) on the x - axis. points on the graph include (0.25, 2500), (2.75, 1100), (5.25, 2500), (7.75, 1100))
answer attempt 1 out of 2
the maximum is (square) and it represents
Look for the highest y-value (volume) on the periodic graph, which is marked at points (0.25, 2500) and (5.25, 2500). This value corresponds to the greatest amount of air in the lungs at a given time.

Snap & solve any problem in the app
Get step-by-step solutions on Sovi AI
Photo-based solutions with guided steps
Explore more problems and detailed explanations
The maximum is 2500 mL and it represents the greatest volume of air in the person's lungs at any point during the breathing cycle.