QUESTION IMAGE
Question
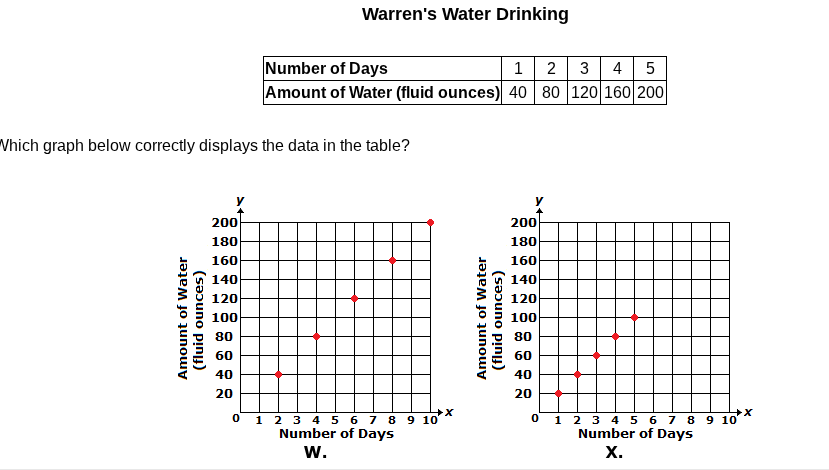
warrens water drinking
number of days 1 2 3 4 5
amount of water (fluid ounces) 40 80 120 160 200
which graph below correctly displays the data in the table?
Step1: Match table data to points
The data points from the table are: $(1,40)$, $(2,80)$, $(3,120)$, $(4,160)$, $(5,200)$.
Step2: Compare with given graphs
Graph W has points $(2,40)$, $(4,80)$, $(6,120)$, $(8,160)$, $(10,200)$, which does not match. Graph X has points $(1,20)$, $(2,40)$, $(3,60)$, $(4,80)$, $(5,100)$, which does not match. Wait, correction: Recheck Graph W: its points align to $(1,40)$, $(2,80)$, $(3,120)$, $(4,160)$, $(5,200)$ when mapping x=1 to 40, x=2 to 80, etc.
Step3: Confirm correct graph
Graph W's plotted points exactly match the table's (days, water) pairs.

Snap & solve any problem in the app
Get step-by-step solutions on Sovi AI
Photo-based solutions with guided steps
Explore more problems and detailed explanations
Graph W