QUESTION IMAGE
Question
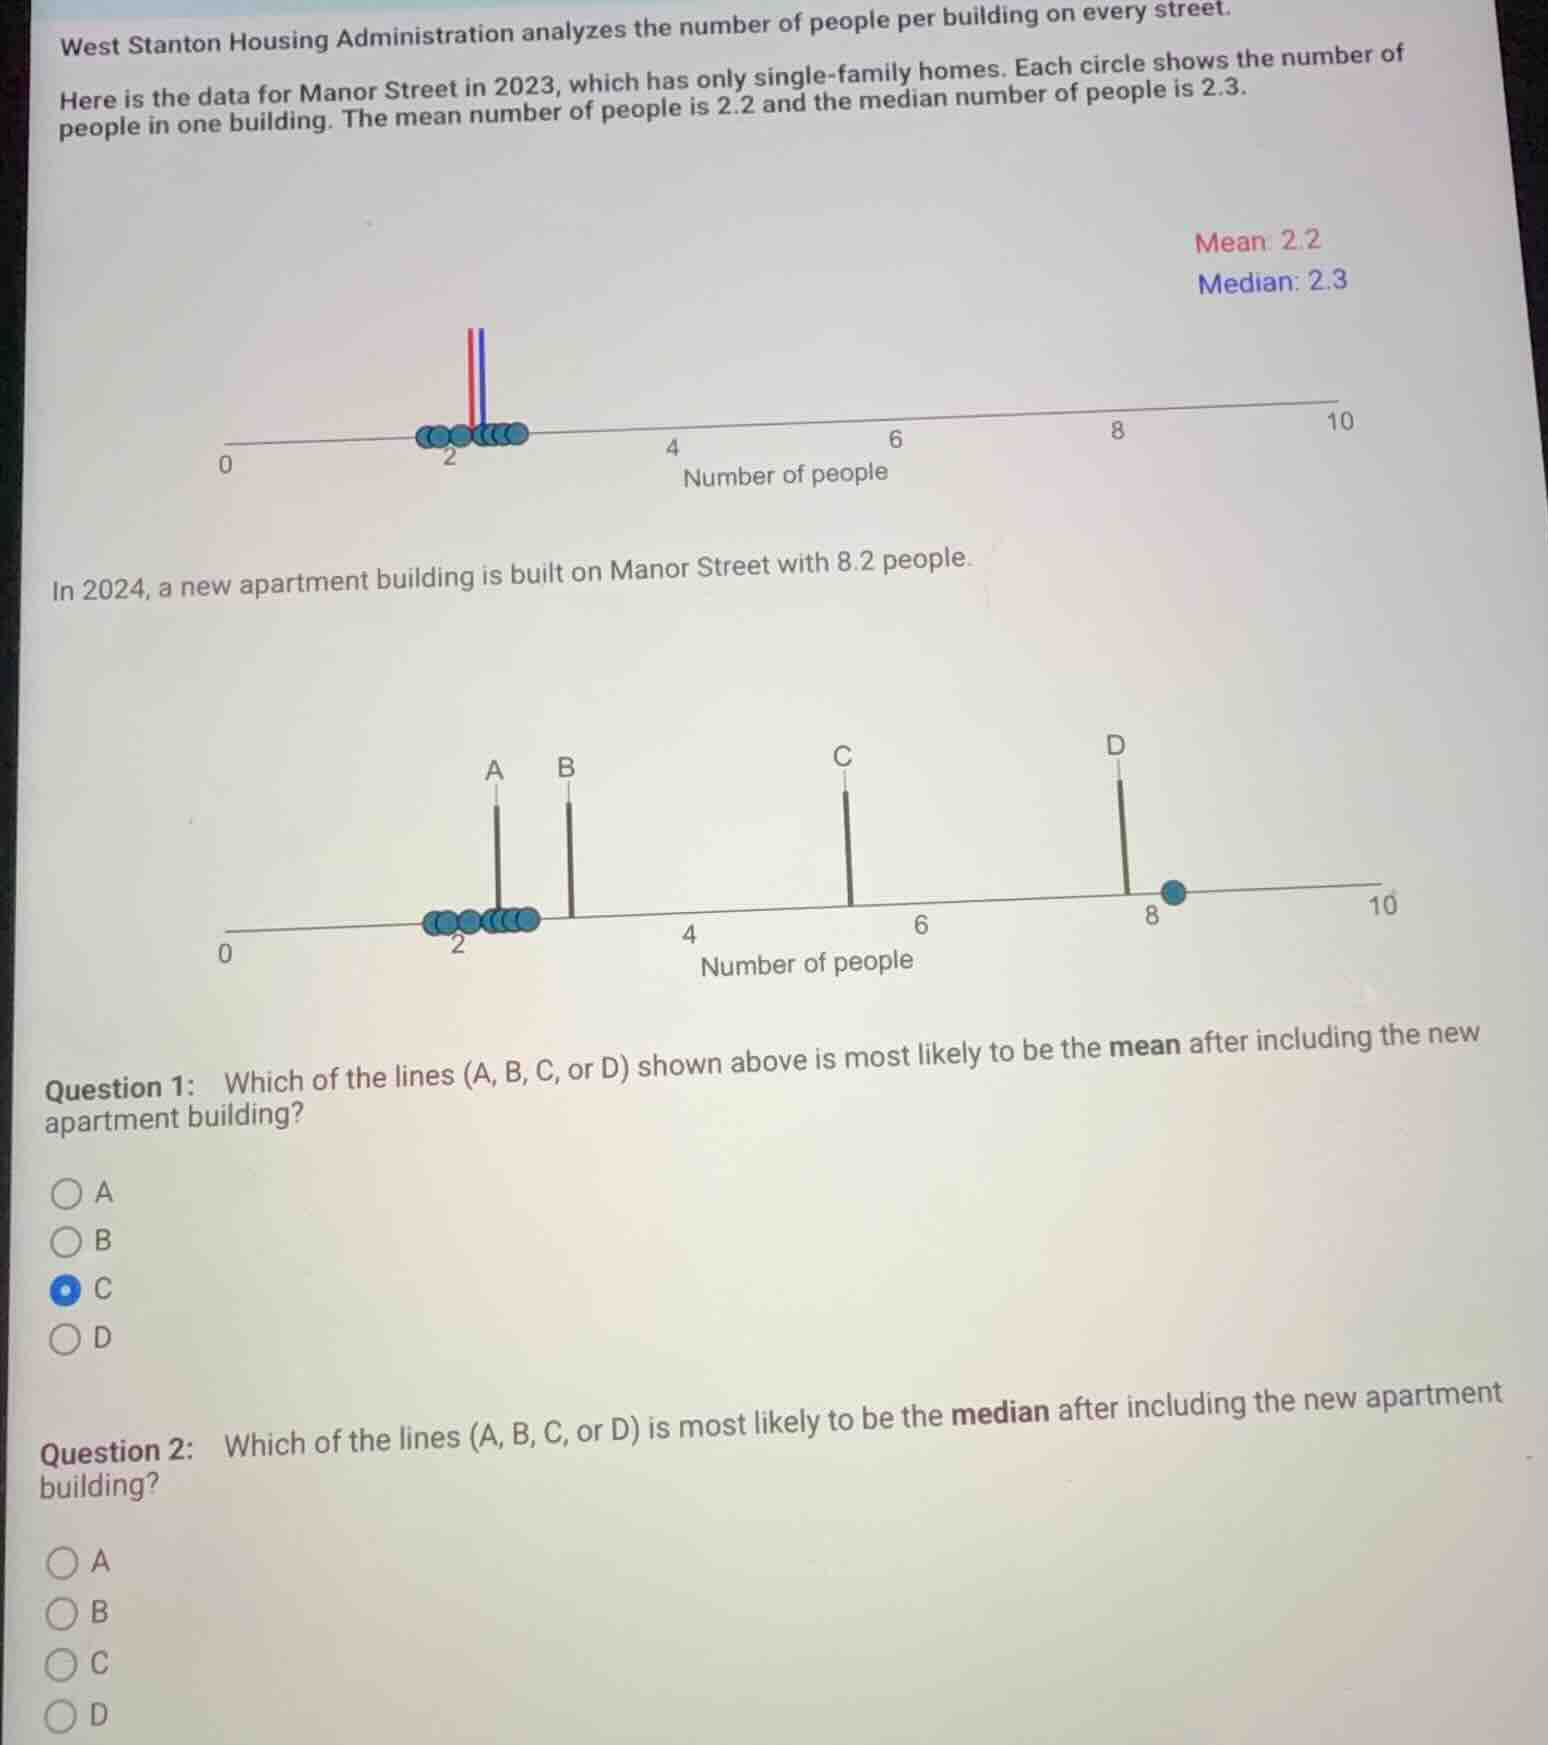
west stanton housing administration analyzes the number of people per building on every street. here is the data for manor street in 2023, which has only single - family homes. each circle shows the number of people in one building. the mean number of people is 2.2 and the median number of people is 2.3. mean: 2.2 median: 2.3 0 2 4 6 8 10 number of people in 2024, a new apartment building is built on manor street with 8.2 people. 0 2 4 6 8 10 number of people a b c d question 1: which of the lines (a, b, c, or d) shown above is most likely to be the mean after including the new apartment building? a b c d question 2: which of the lines (a, b, c, or d) is most likely to be the median after including the new apartment building? a b c d
Step1: Find original number of buildings
Let $n$ = number of 2023 buildings. Mean = $\frac{\text{Total people}}{n}$, so total 2023 people = $2.2n$.
Step2: Calculate new total and count
New total people = $2.2n + 8.2$, new count = $n+1$.
Step3: Find original $n$ from median
Median 2.3: sorted data has middle value 2.3. Count circles: 7 buildings (3 at 2, 4 at 3). $n=7$.
Step4: Compute new mean
New mean = $\frac{2.2(7) + 8.2}{7+1} = \frac{15.4 + 8.2}{8} = \frac{23.6}{8} = 2.95$
Step5: Compute new median
Sorted data: 3 values of 2, 4 values of 3, 1 value of 8.2. Total 8 values, median = average of 4th and 5th values: $\frac{3+3}{2}=3$

Snap & solve any problem in the app
Get step-by-step solutions on Sovi AI
Photo-based solutions with guided steps
Explore more problems and detailed explanations
Question 1: B. Line at ~3 (matches 2.95)
Question 2: B. Line at 3 (matches new median)