QUESTION IMAGE
Question
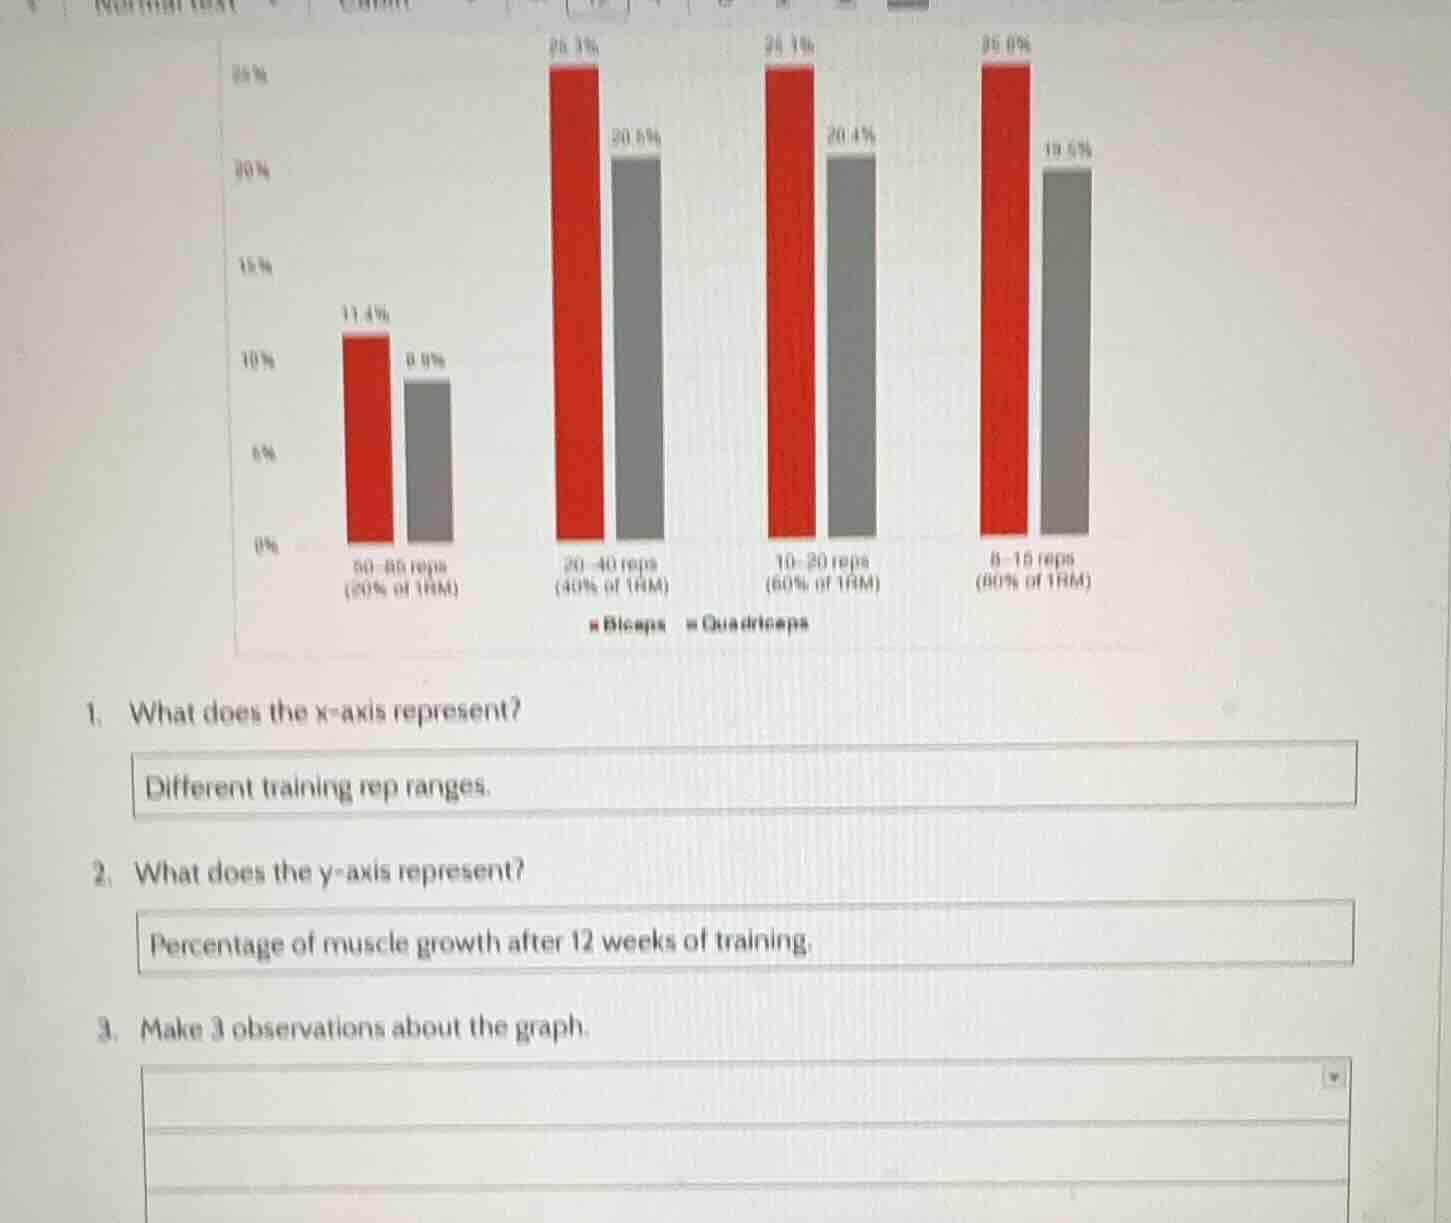
- what does the x - axis represent?
different training rep ranges.
- what does the y - axis represent?
percentage of muscle growth after 12 weeks of training.
- make 3 observations about the graph.
Brief Explanations
- Compare bicep growth across all rep ranges to find the highest value.
- Compare quadriceps growth across all rep ranges to find the lowest value.
- Compare bicep and quadriceps growth for every rep range to identify a consistent trend.

Snap & solve any problem in the app
Get step-by-step solutions on Sovi AI
Photo-based solutions with guided steps
Explore more problems and detailed explanations
- The biceps show the highest percentage of muscle growth (25.0%) in the 8-15 reps (80% of 1RM) range.
- The quadriceps show the lowest percentage of muscle growth (8.9%) in the 50-80 reps (20% of 1RM) range.
- For every tested rep range, the biceps have a higher percentage of muscle growth than the quadriceps.