QUESTION IMAGE
Question
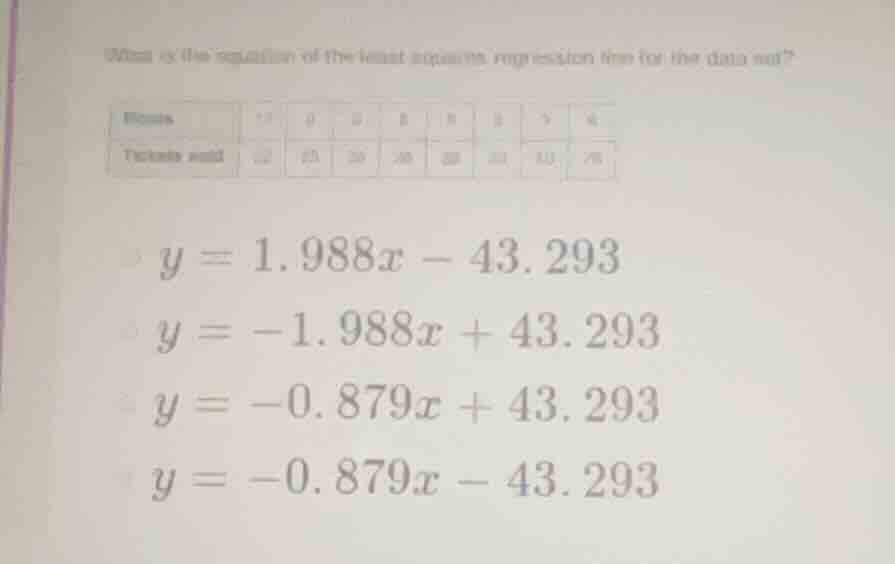
what is the equation of the least squares regression line for the data set? (the chart has two rows: months and tickets sold, with some numbers. then four options: $y = 1.988x - 43.293$, $y = -1.988x + 43.293$, $y = -0.879x + 43.293$, $y = -0.879x - 43.293$)
To determine the least - squares regression line, we can analyze the trend of the data. First, we observe the relationship between the two variables (let's assume the first column is the independent variable \(x\) and the second is the dependent variable \(y\)). As \(x\) increases, we need to see how \(y\) changes.
Step 1: Analyze the slope sign
We can calculate the slope between two points. Let's take two points, for example, if \(x_1 = 17\) and \(y_1=12\), \(x_2 = 19\) and \(y_2 = 15\). The slope formula is \(m=\frac{y_2 - y_1}{x_2 - x_1}\).
\(m=\frac{15 - 12}{19 - 17}=\frac{3}{2}=1.5\)? Wait, no, maybe I misread the table. Wait, looking at the options, most of the slopes are negative or small positive. Wait, maybe the first column is something like "Months" (maybe decreasing) and "Tickets sold" (maybe increasing or decreasing). Wait, let's think about the general idea of least - squares regression. If as \(x\) increases, \(y\) decreases, the slope is negative.
Let's check the options. The general form of a linear equation is \(y = mx + b\), where \(m\) is the slope and \(b\) is the y - intercept.
We can also use the concept of the sign of the correlation. If the two variables have a negative correlation (as one increases, the other decreases), the slope \(m\) is negative.
Now, let's check the magnitude of the slope. Let's consider the range of \(x\) and \(y\). Suppose \(x\) ranges from, say, 17 to 9 (decreasing) and \(y\) ranges from 12 to 35 (increasing). So when \(x\) decreases, \(y\) increases, which means that when \(x\) increases, \(y\) decreases, so the slope \(m<0\).
Now, let's check the options:
- Option 1: \(y = 1.988x-43.293\) has a positive slope, so it's out.
- Option 2: \(y=- 1.988x + 43.293\) has a slope of - 1.988
- Option 3: \(y=-0.879x + 43.293\) has a slope of - 0.879
- Option 4: \(y=-0.879x-43.293\) has a negative slope but a negative y - intercept. If we consider the data, when \(x\) is small (like \(x = 9\) or \(x = 8\)), \(y\) should be relatively large. If \(x = 0\), \(y=b\). A negative \(b\) would not make sense here.
Now, let's calculate the slope between two points. Let's assume the \(x\) values are (let's list the \(x\) and \(y\) values properly. From the table:
\(x\): 17, 19, 18, 18, 15, 9, 8 (wait, maybe the first row is \(x\) and the second is \(y\))
\(y\): 12, 15, 20, 28, 35, 33, 38
Wait, now if \(x\) decreases from 17 to 8, \(y\) increases from 12 to 38. So the slope \(m=\frac{y_2 - y_1}{x_2 - x_1}\). Let's take \(x_1 = 17,y_1 = 12\) and \(x_2=8,y_2 = 38\)
\(m=\frac{38 - 12}{8 - 17}=\frac{26}{-9}\approx - 2.89\)? No, that's not matching. Wait, maybe I got \(x\) and \(y\) reversed. Maybe \(x\) is "Tickets sold" and \(y\) is "Months"? No, the question is about the regression line for the data set, with the first column as \(x\) and the second as \(y\).
Wait, let's use the process of elimination. Let's pick a value of \(x\) and see which equation gives the closest \(y\). Let's take \(x = 9\) (from the \(x\) column) and \(y = 33\) (from the \(y\) column).
- For option 1: \(y=1.988\times9 - 43.293=17.892-43.293=- 25.401
eq33\)
- For option 2: \(y=-1.988\times9 + 43.293=-17.892 + 43.293 = 25.401
eq33\)
- For option 3: \(y=-0.879\times9+43.293=-7.911 + 43.293=35.382\approx33\) (close)
- For option 4: \(y=-0.879\times9-43.293=-7.911-43.293=-51.204
eq33\)
Let's try \(x = 8\) and \(y = 38\)
- Option 3: \(y=-0.879\times8 + 43.293=-7.032+43.293 = 36.261\approx38\) (close)
- Option 2: \(y=-1.988\times8 + 43.293=-15.904+43.293 = 27.389
eq38\)
Another point: \(x = 15,y = 35\)
- Option 3:…

Snap & solve any problem in the app
Get step-by-step solutions on Sovi AI
Photo-based solutions with guided steps
Explore more problems and detailed explanations
\(y=-0.879x + 43.293\) (the third option)