QUESTION IMAGE
Question
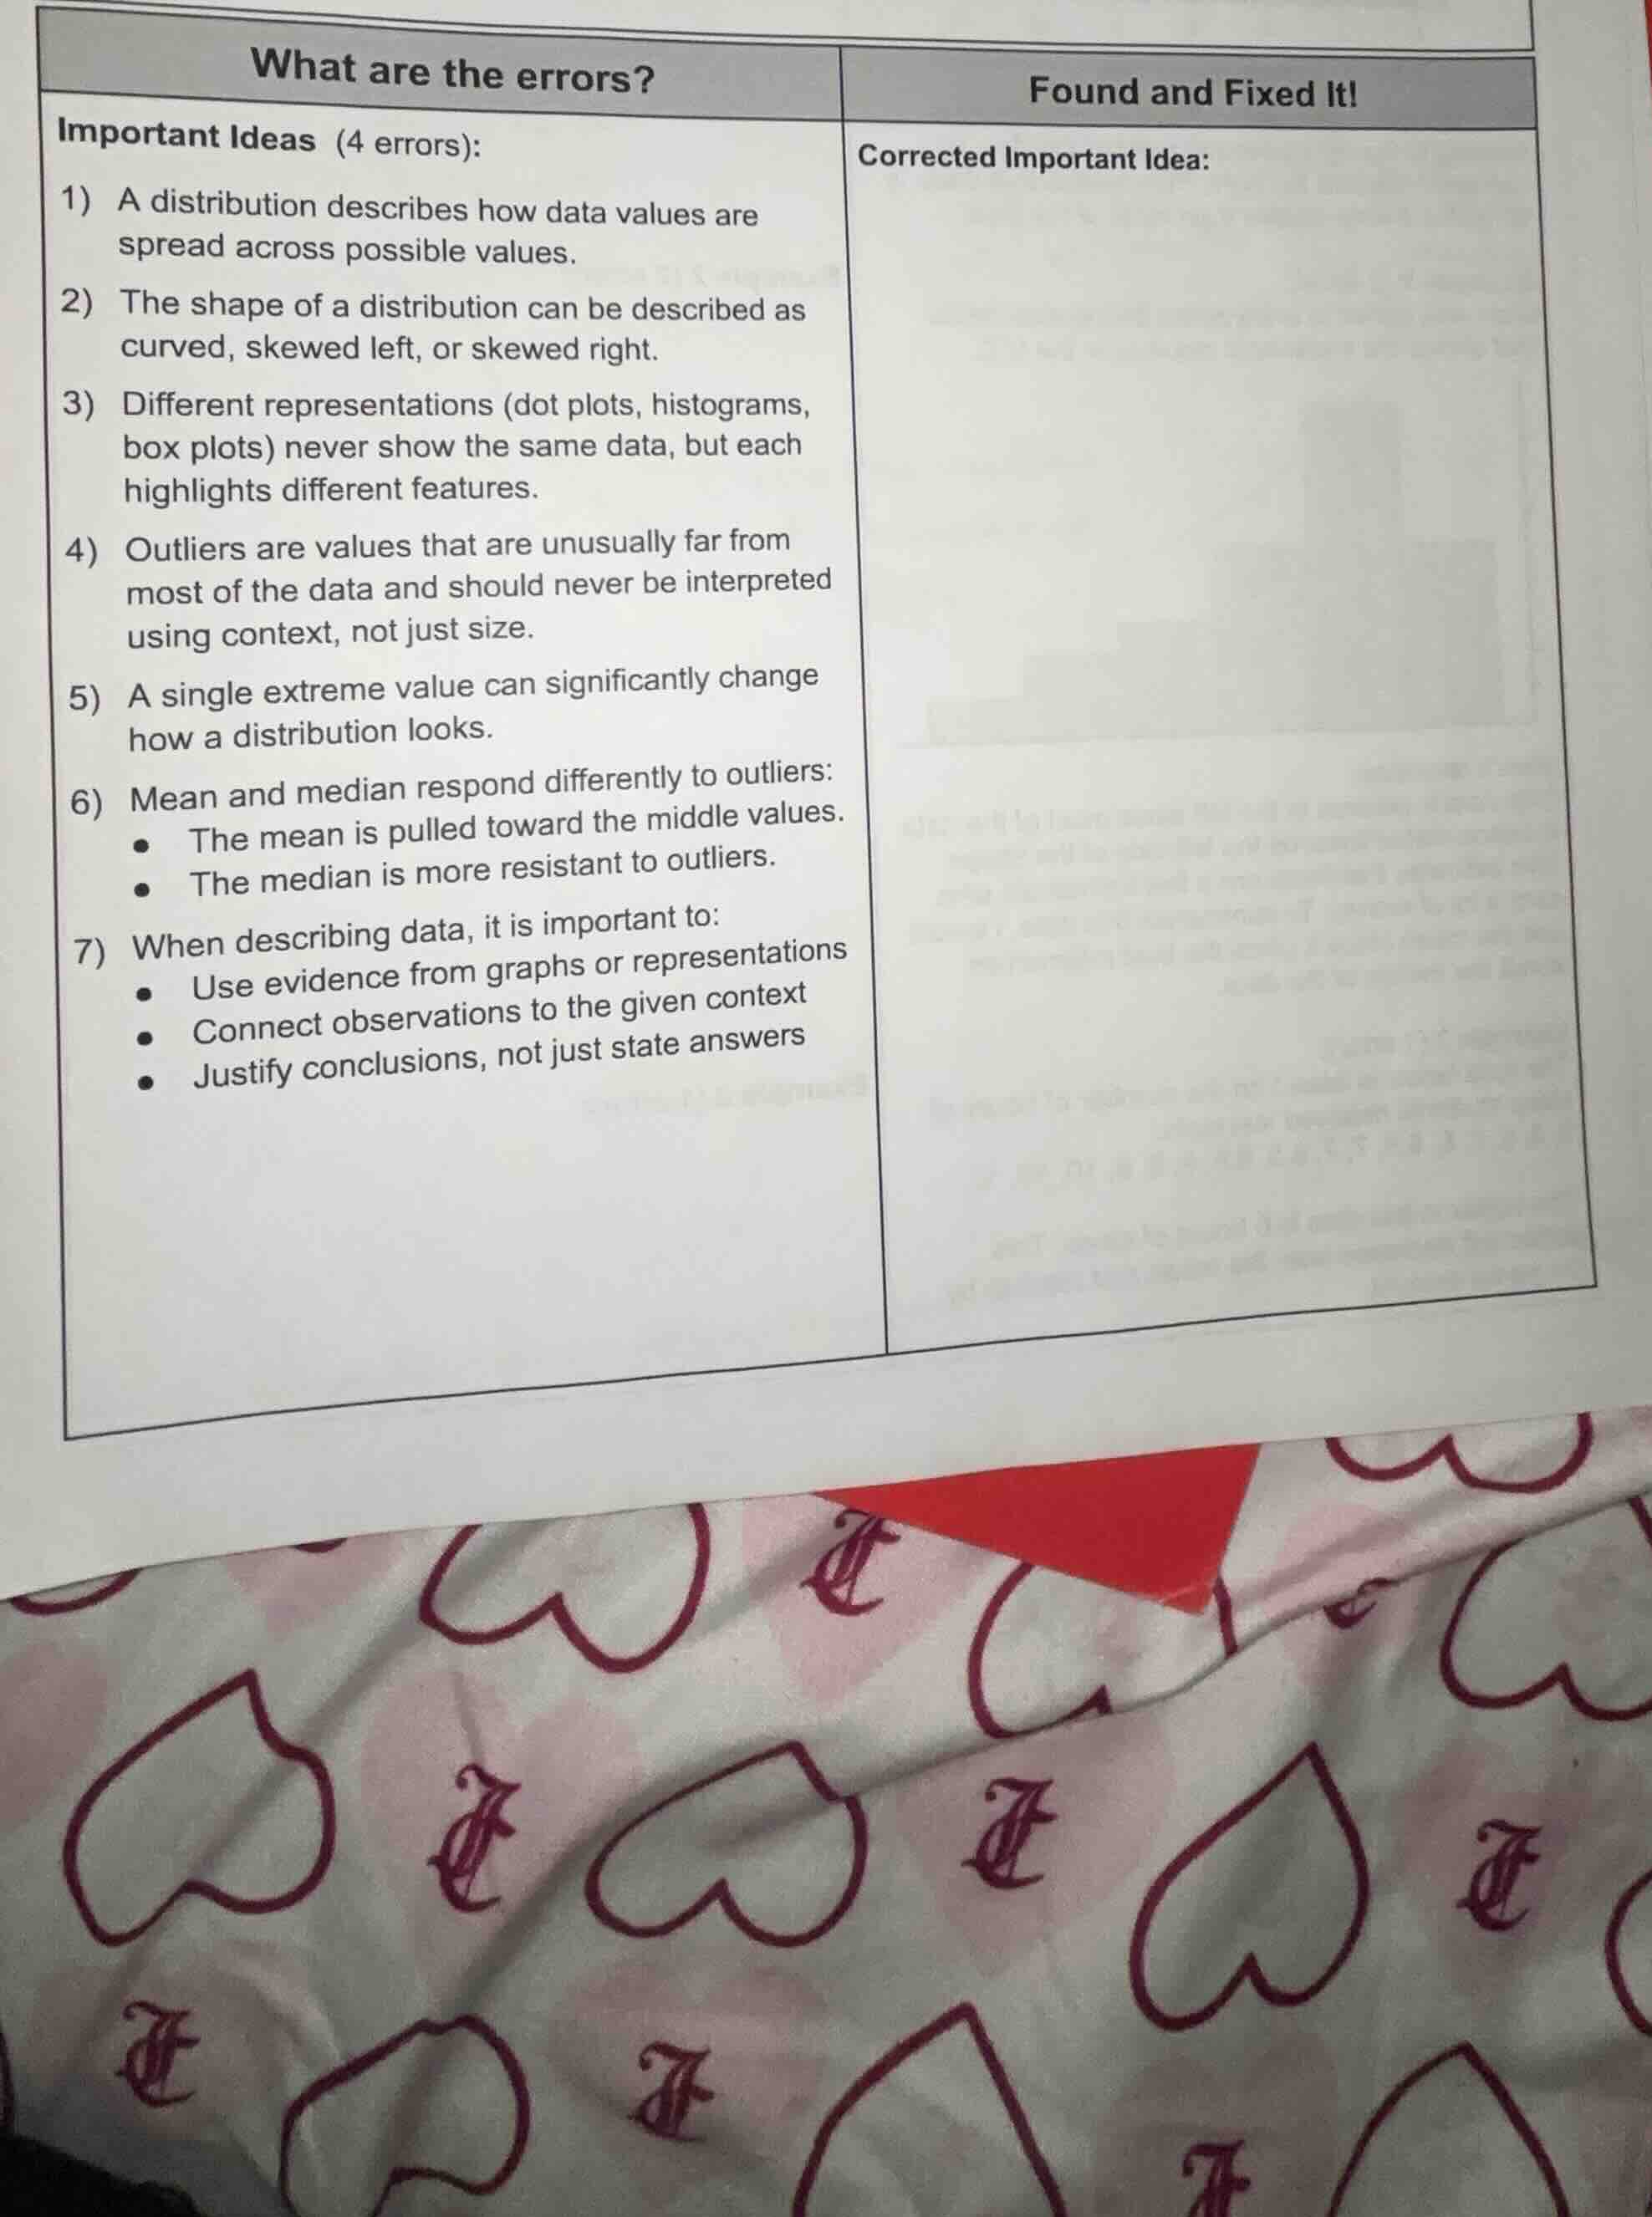
what are the errors?
important ideas (4 errors):
- a distribution describes how data values are spread across possible values.
- the shape of a distribution can be described as curved, skewed left, or skewed right.
- different representations (dot plots, histograms, box plots) never show the same data, but each highlights different features.
- outliers are values that are unusually far from most of the data and should never be interpreted using context, not just size.
- a single extreme value can significantly change how a distribution looks.
- mean and median respond differently to outliers:
- the mean is pulled toward the middle values.
- the median is more resistant to outliers.
- when describing data, it is important to:
- use evidence from graphs or representations
- connect observations to the given context
- justify conclusions, not just state answers
found and fixed it!
corrected important idea:
Brief Explanations
- For statement 2: The shape of a distribution is typically described as symmetric (or bell - shaped), skewed left, or skewed right, not "curved".
- For statement 3: Different representations (dot plots, histograms, box plots) can show the same data, but each highlights different features. The word "never" is incorrect.
- For statement 4: Outliers are values that are unusually far from most of the data and should always be interpreted using context, not just size. The word "never" is incorrect.
- For statement 6: The mean is pulled toward the extreme values (outliers), not the middle values. The median is more resistant to outliers.

Snap & solve any problem in the app
Get step-by-step solutions on Sovi AI
Photo-based solutions with guided steps
Explore more problems and detailed explanations
- Corrected statement 2: The shape of a distribution can be described as symmetric, skewed left, or skewed right.
- Corrected statement 3: Different representations (dot plots, histograms, box plots) can show the same data, but each highlights different features.
- Corrected statement 4: Outliers are values that are unusually far from most of the data and should always be interpreted using context, not just size.
- Corrected statement 6: Mean and median respond differently to outliers:
- The mean is pulled toward the extreme values.
- The median is more resistant to outliers.