QUESTION IMAGE
Question
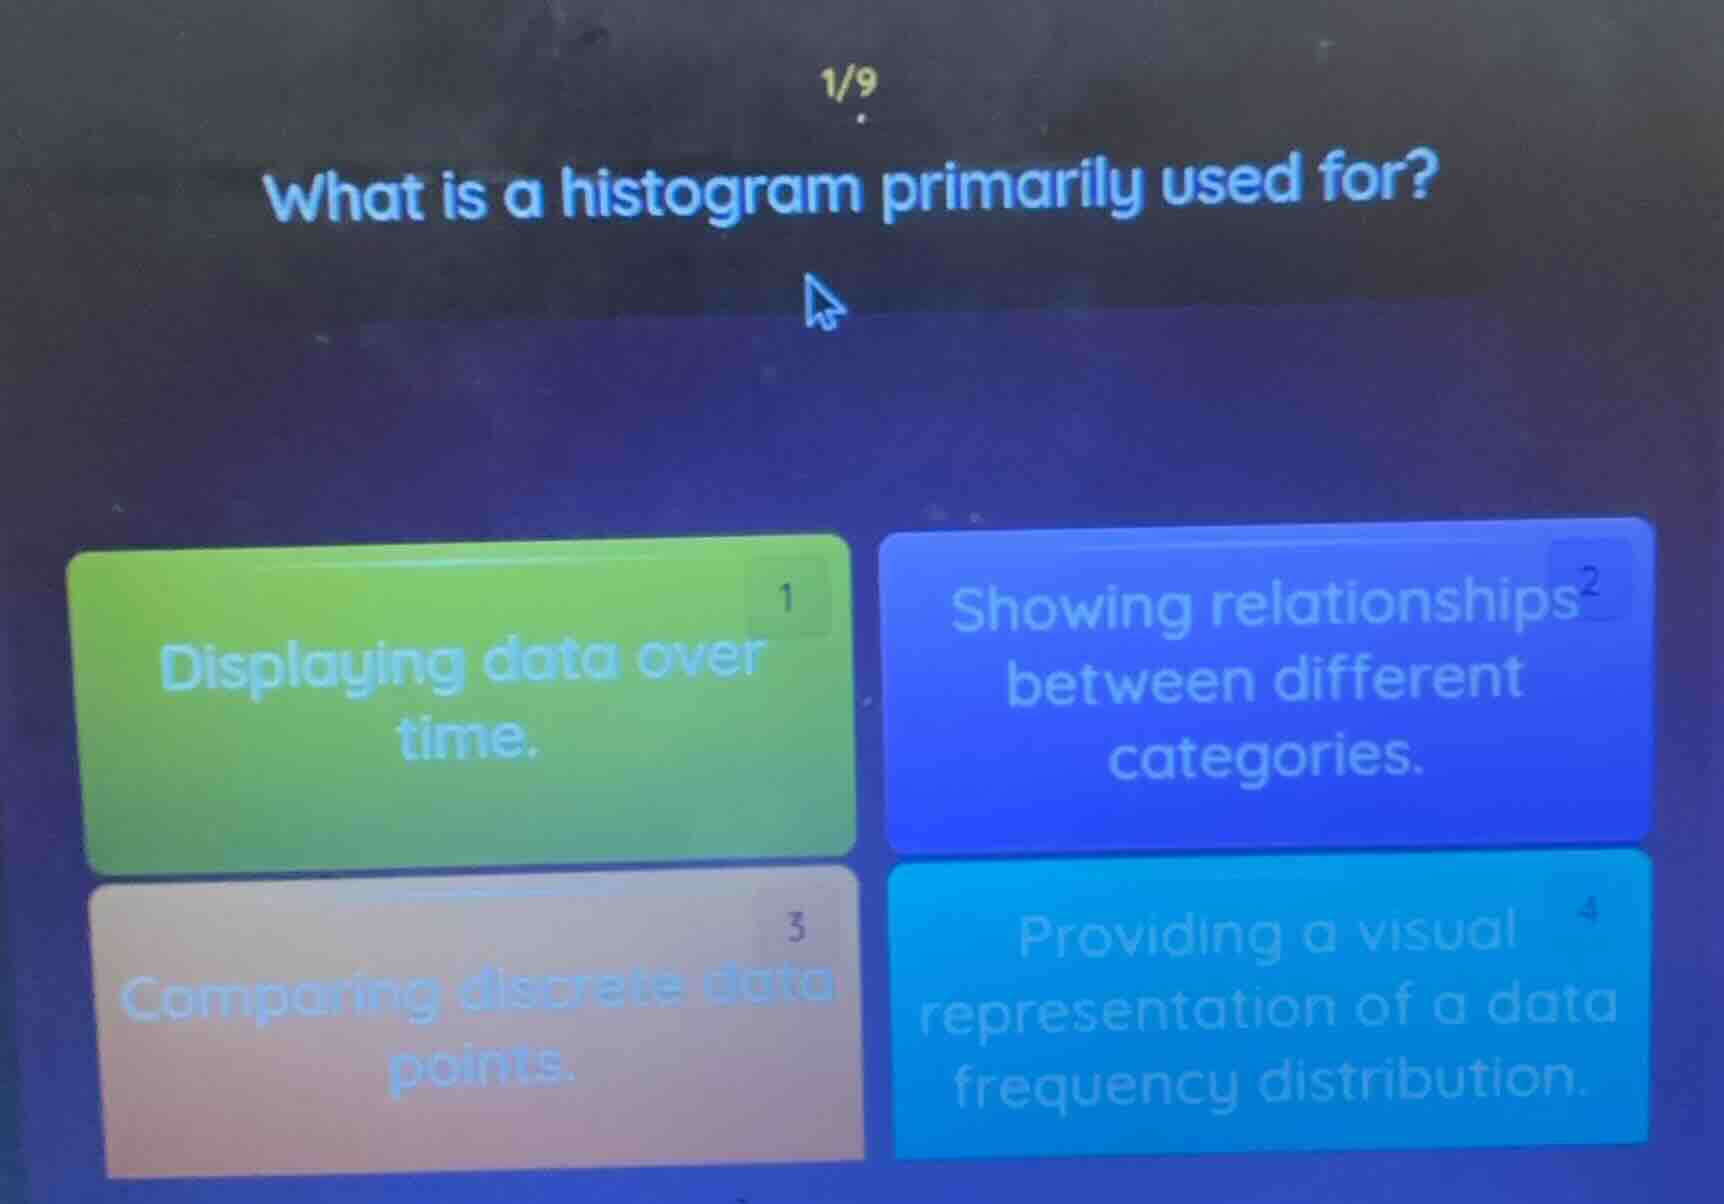
1/9 what is a histogram primarily used for? 1 displaying data over time. 2 showing relationships between different categories. 3 comparing discrete data points. 4 providing a visual representation of a data frequency distribution.
A histogram is a data visualization tool specifically designed to group continuous (or discrete binned) data into intervals and display how frequently values fall into each interval. Option 1 describes line charts, option 2 describes bar charts for categorical comparisons, and option 3 refers to plots for individual discrete points. Only option 4 matches the core purpose of a histogram.

Snap & solve any problem in the app
Get step-by-step solutions on Sovi AI
Photo-based solutions with guided steps
Explore more problems and detailed explanations
- Providing a visual representation of a data frequency distribution.