QUESTION IMAGE
Question
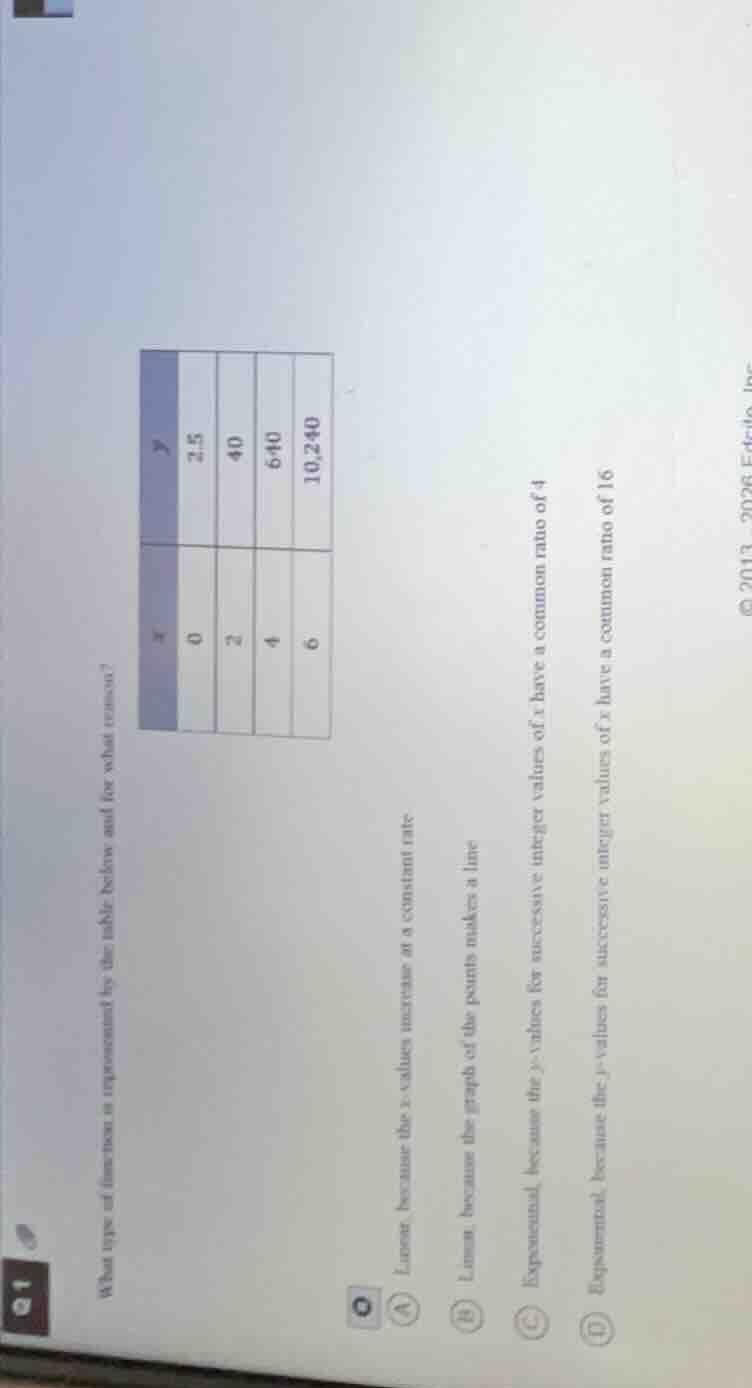
what type of function is represented by the table below and for what reason?
| $x$ | $y$ | ----- | ----- | 0 | 2.5 | 2 | 40 | 4 | 640 | 6 | 10,240 | a linear, because the $x$-values increase at a constant rateb linear, because the graph of the points makes a linec exponential, because the $y$-values for successive integer values of $x$ have a common ratio of 4d exponential, because the $y$-values for successive integer values of $x$ have a common ratio of 16 |
Step1: Check linearity (constant y-change)
Calculate differences between consecutive y-values:
$40 - 2.5 = 37.5$
$640 - 40 = 600$
$10240 - 640 = 9600$
Differences are not constant, so not linear.
Step2: Check exponential (constant ratio)
Calculate ratios of consecutive y-values:
$\frac{40}{2.5} = 16$
$\frac{640}{40} = 16$
$\frac{10240}{640} = 16$
Ratios are constant (16), so exponential.

Snap & solve any problem in the app
Get step-by-step solutions on Sovi AI
Photo-based solutions with guided steps
Explore more problems and detailed explanations
D. Exponential, because the y-values for successive integer values of x have a common ratio of 16