QUESTION IMAGE
Question
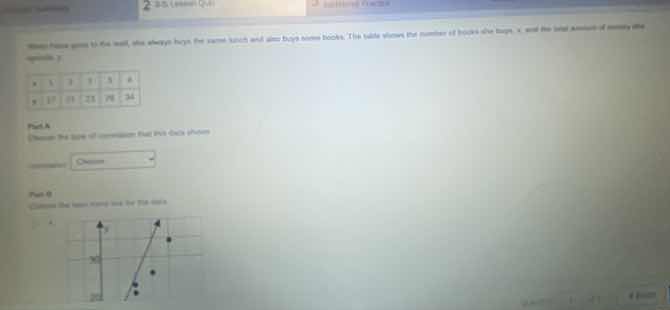
when marco goes to the mall, he always buys the same lunch and also buys some books. the table shows the number of books he buys, x, and the total amount of money he spends, y.
part a
report the rate of commission that avas data shows
part b
choose the best trend line for the data
Step1: Identify correlation trend
Observe the data: as $x$ (number of books) increases, $y$ (money spent) increases. So it is a positive correlation.
Step2: Match to best fit line
The best fit line should follow the upward trend of the data points, passing near the cluster of points. The line that slopes upward and aligns with the increasing $(x,y)$ pairs is the correct one.

Snap & solve any problem in the app
Get step-by-step solutions on Sovi AI
Photo-based solutions with guided steps
Explore more problems and detailed explanations
Part A
positive
Part B
The line that shows an upward slope, closely following the direction of the plotted data points (the steepest upward line among the options)