QUESTION IMAGE
Question
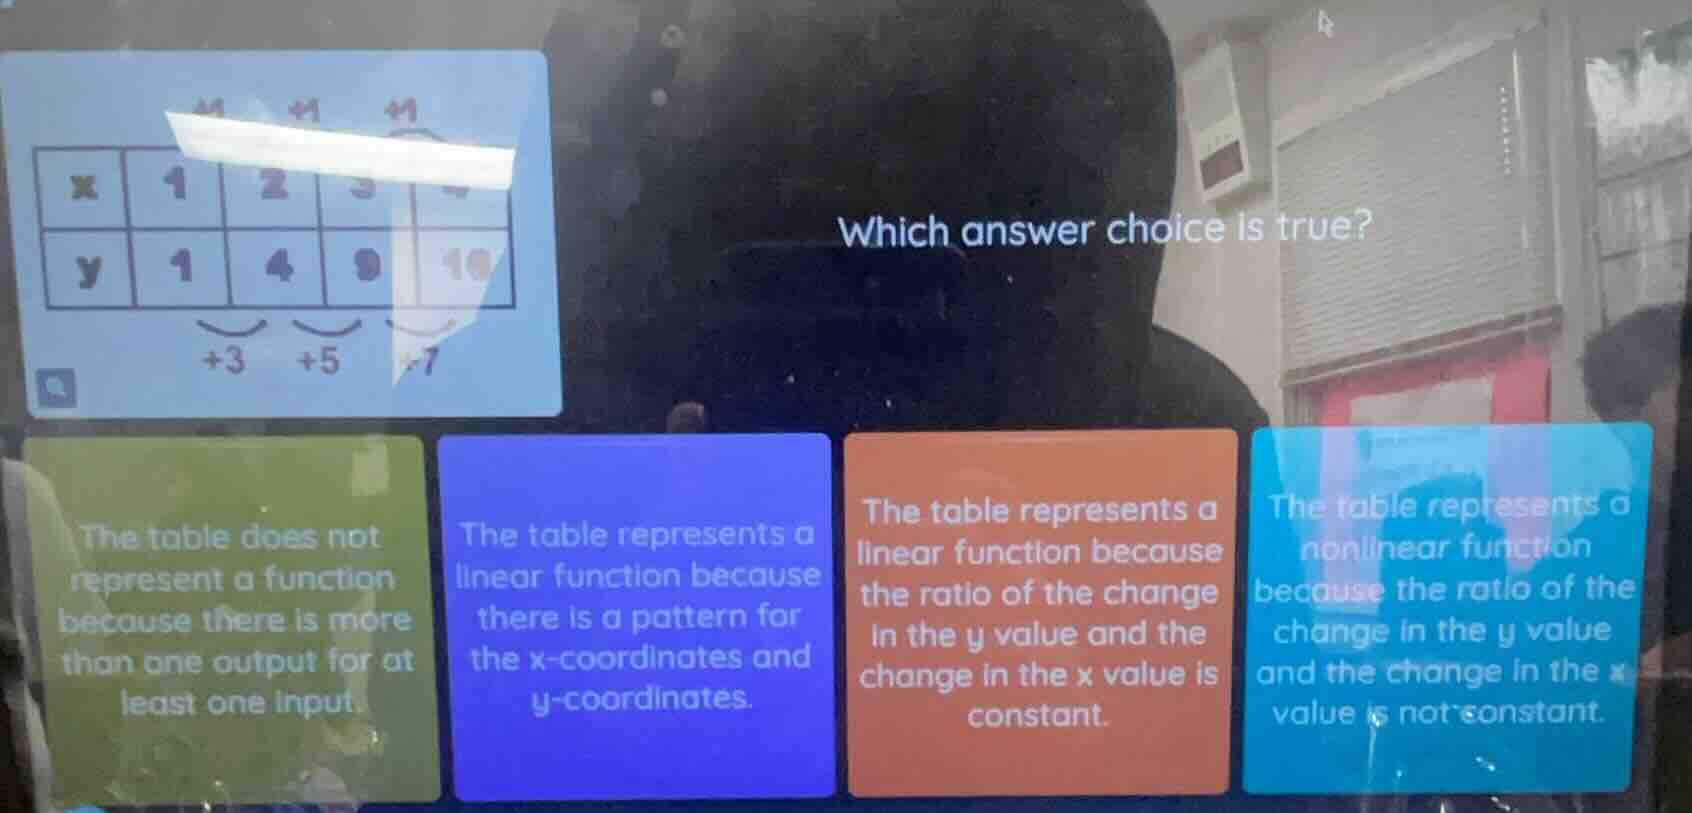
which answer choice is true? the table does not represent a function because there is more than one output for at least one input. the table represents a linear function because there is a pattern for the x - coordinates and y - coordinates. the table represents a linear function because the ratio of the change in the y value and the change in the x value is constant. the table represents a nonlinear function because the ratio of the change in the y value and the change in the x value is not constant.
Step1: Recall function and linear function definitions
A function is a relation where each input (x - value) has exactly one output (y - value). Here, for x = 1, y = 1; x = 2, y = 4; x = 3, y = 9; x = 4, y = 16 (assuming the last y - value is 16, maybe a typo in the image, since \(1^2 = 1\), \(2^2=4\), \(3^2 = 9\), \(4^2=16\)). Each x has one y, so it is a function.
A linear function has a constant rate of change, i.e., \(\frac{\Delta y}{\Delta x}\) is constant. Let's calculate \(\Delta y\) and \(\Delta x\):
For \(x\) from 1 to 2: \(\Delta x=2 - 1 = 1\), \(\Delta y=4 - 1 = 3\), \(\frac{\Delta y}{\Delta x}=\frac{3}{1}=3\)
For \(x\) from 2 to 3: \(\Delta x=3 - 2 = 1\), \(\Delta y=9 - 4 = 5\), \(\frac{\Delta y}{\Delta x}=\frac{5}{1}=5\)
For \(x\) from 3 to 4: \(\Delta x=4 - 3 = 1\), \(\Delta y = 16-9=7\), \(\frac{\Delta y}{\Delta x}=\frac{7}{1}=7\)
The ratio \(\frac{\Delta y}{\Delta x}\) is 3, 5, 7, which is not constant. So the rate of change is not constant, so it's a nonlinear function.
Step2: Analyze each option
- Green option: The table does represent a function (each x has one y), so this is false.
- Blue option: A pattern in x and y coordinates doesn't mean it's linear. Linear requires constant rate of change. So this is false.
- Orange option: The ratio of change in y to change in x is not constant (3, 5, 7), so this is false.
- Light blue option: The table represents a nonlinear function because the ratio of the change in the y - value and the change in the x - value is not constant. This matches our analysis.

Snap & solve any problem in the app
Get step-by-step solutions on Sovi AI
Photo-based solutions with guided steps
Explore more problems and detailed explanations
The table represents a nonlinear function because the ratio of the change in the y value and the change in the x value is not constant. (The light - blue colored option)