QUESTION IMAGE
Question
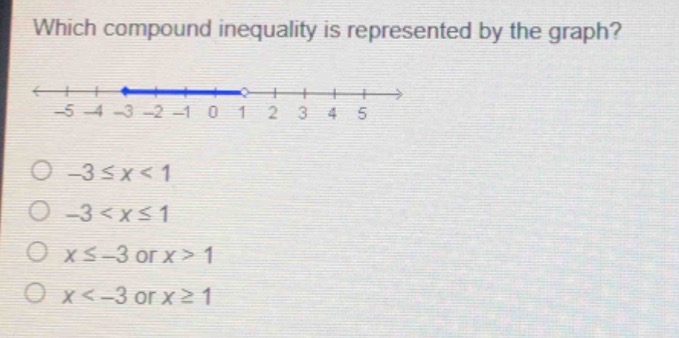
which compound inequality is represented by the graph? -5 -4 -3 -2 -1 0 1 2 3 4 5 -3 ≤ x < 1 -3 < x ≤ 1 x ≤ -3 or x > 1 x < -3 or x ≥ 1
Brief Explanations
- Analyze the graph: The blue line starts at -3 (with a closed circle, meaning -3 is included) and goes up to 1 (with an open circle, meaning 1 is not included).
- Interpret the inequality: A closed circle at -3 means \( x \geq -3 \) (or \( -3 \leq x \)), and an open circle at 1 means \( x < 1 \). Combining these, the compound inequality is \( -3 \leq x < 1 \).
- Eliminate other options:
- Option \( -3 < x \leq 1 \) is incorrect because -3 is included (closed circle) and 1 is not (open circle), so the signs are reversed.
- Options with "or" are incorrect because the graph shows a single segment (not two separate regions), so it's a compound inequality with "and" (the solution is the overlap of two inequalities), not "or".

Snap & solve any problem in the app
Get step-by-step solutions on Sovi AI
Photo-based solutions with guided steps
Explore more problems and detailed explanations
A. \( -3 \leq x < 1 \)