QUESTION IMAGE
Question
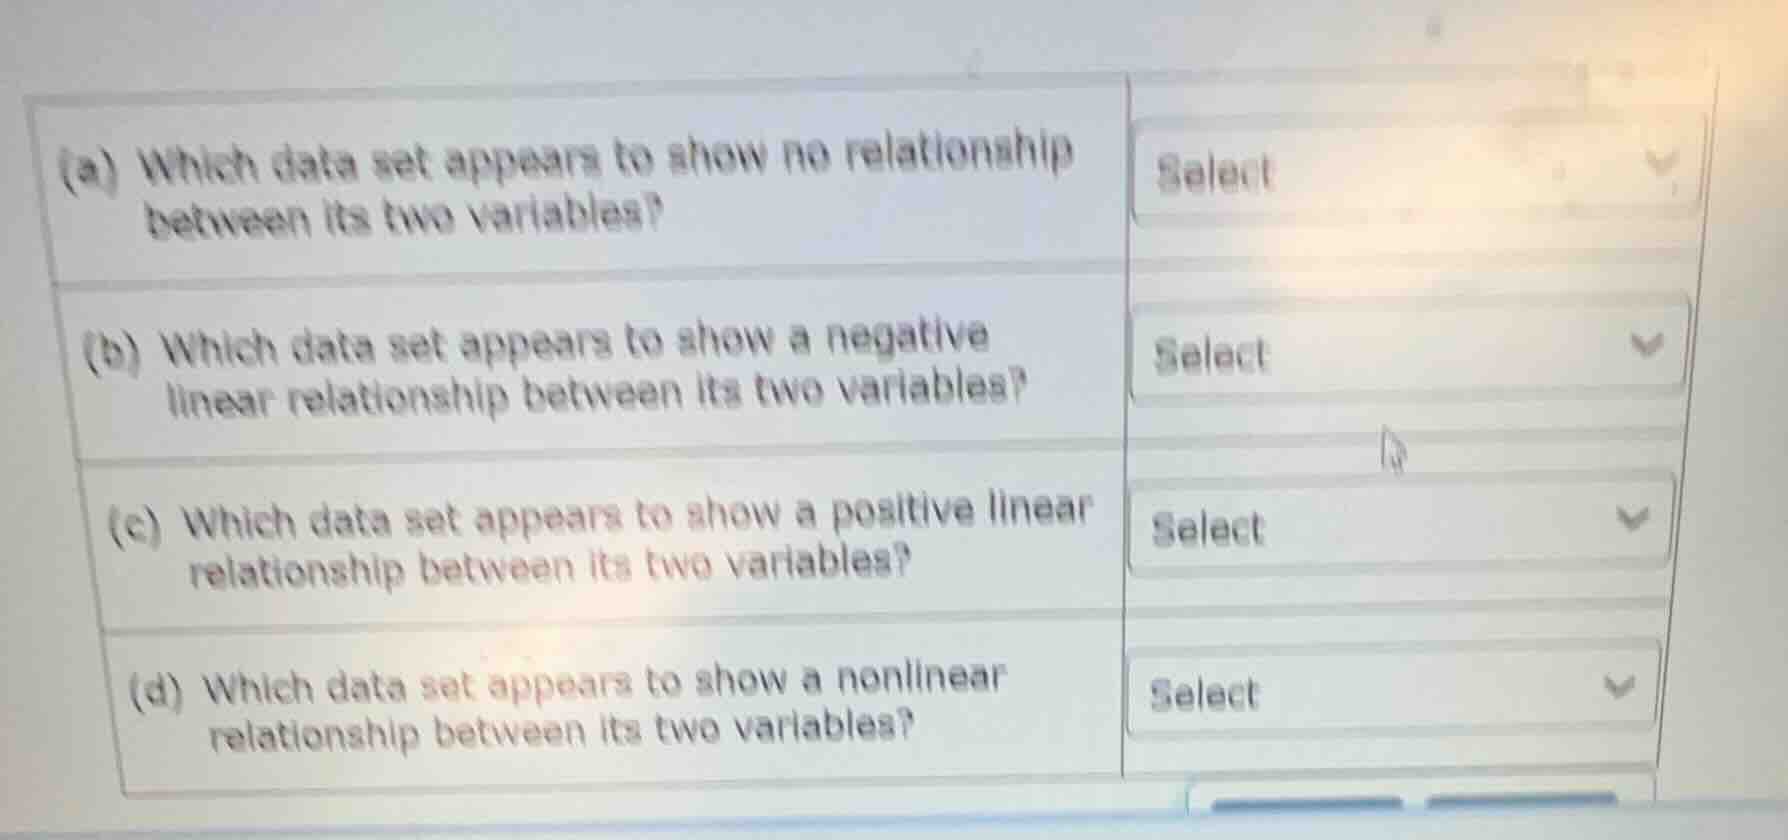
(a) which data set appears to show no relationship between its two variables? select (b) which data set appears to show a negative linear relationship between its two variables? select (c) which data set appears to show a positive linear relationship between its two variables? select (d) which data set appears to show a nonlinear relationship between its two variables? select
To solve these problems, we analyze the relationships between variables in data sets (even though the actual data sets aren't shown, we use the definitions of relationships):
Part (a)
A data set with no relationship between two variables has points scattered randomly (no pattern). So we identify the data set with no discernible trend (random scatter).
Part (b)
A negative linear relationship means as one variable increases, the other decreases in a roughly straight - line pattern. We look for a data set where the points trend downward from left to right in a linear way.
Part (c)
A positive linear relationship means as one variable increases, the other also increases in a roughly straight - line pattern. We look for a data set where the points trend upward from left to right in a linear way.
Part (d)
A nonlinear relationship means the points follow a curve (not a straight line), like a parabola, exponential curve, etc. We look for a data set with a curved pattern.
Since the actual data sets (the options for “Select”) are not provided, we can't give the final answer. But the process is:
- For (a): Find the data set with random, uncorrelated points.
- For (b): Find the data set with a negative, linear trend.
- For (c): Find the data set with a positive, linear trend.
- For (d): Find the data set with a curved (non - linear) trend.
If you provide the options (the data sets to choose from), we can determine the exact answers.

Snap & solve any problem in the app
Get step-by-step solutions on Sovi AI
Photo-based solutions with guided steps
Explore more problems and detailed explanations
To solve these problems, we analyze the relationships between variables in data sets (even though the actual data sets aren't shown, we use the definitions of relationships):
Part (a)
A data set with no relationship between two variables has points scattered randomly (no pattern). So we identify the data set with no discernible trend (random scatter).
Part (b)
A negative linear relationship means as one variable increases, the other decreases in a roughly straight - line pattern. We look for a data set where the points trend downward from left to right in a linear way.
Part (c)
A positive linear relationship means as one variable increases, the other also increases in a roughly straight - line pattern. We look for a data set where the points trend upward from left to right in a linear way.
Part (d)
A nonlinear relationship means the points follow a curve (not a straight line), like a parabola, exponential curve, etc. We look for a data set with a curved pattern.
Since the actual data sets (the options for “Select”) are not provided, we can't give the final answer. But the process is:
- For (a): Find the data set with random, uncorrelated points.
- For (b): Find the data set with a negative, linear trend.
- For (c): Find the data set with a positive, linear trend.
- For (d): Find the data set with a curved (non - linear) trend.
If you provide the options (the data sets to choose from), we can determine the exact answers.