QUESTION IMAGE
Question
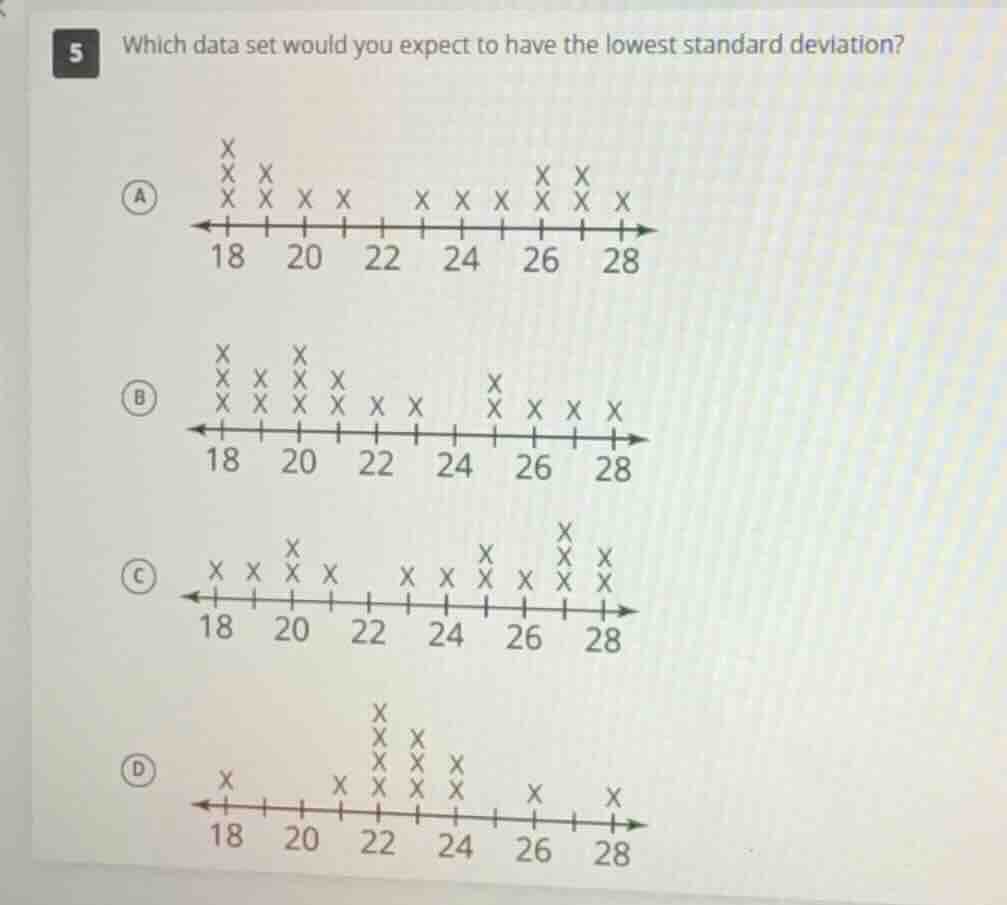
5 which data set would you expect to have the lowest standard deviation?
a: a dot plot with the number line labeled 18, 20, 22, 24, 26, 28. there are 3 xs over 18, 2 xs over 19, 1 x over 20, 1 x over 21, 1 x over 23, 1 x over 24, 1 x over 25, 2 xs over 26, 2 xs over 27, and 1 x over 28.
b: a dot plot with the number line labeled 18, 20, 22, 24, 26, 28. there are 3 xs over 18, 2 xs over 19, 3 xs over 20, 2 xs over 21, 1 x over 22, 1 x over 23, 2 xs over 25, 1 x over 26, 1 x over 27, and 1 x over 28.
c: a dot plot with the number line labeled 18, 20, 22, 24, 26, 28. there are 1 x over 18, 1 x over 19, 2 xs over 20, 1 x over 21, 1 x over 23, 1 x over 24, 2 xs over 25, 1 x over 26, 3 xs over 27, and 2 xs over 28.
d: a dot plot with the number line labeled 18, 20, 22, 24, 26, 28. there is 1 x over 18, 1 x over 21, 3 xs over 22, 3 xs over 23, 2 xs over 24, 1 x over 26, and 1 x over 28.
Step1: Understand Standard Deviation
Standard deviation measures the spread of data from the mean. A lower standard deviation means data points are closer to the mean.
Step2: Analyze Each Data Set
- Option A: Data points are spread from 18 to 28, with some clustering but not as tight as others? Wait, no—wait, let's look at the clusters. Wait, actually, let's check the concentration. Wait, no, let's re-express: the key is which data set has data points closest to each other (i.e., most concentrated around a central value).
Wait, actually, let's look at the dot plots:
- Option D: Data is centered around 22 - 24? Wait, no, let's count the dots. Wait, no, the correct approach is: the data set with the most data points clustered closely together (i.e., least spread out) will have the lowest standard deviation.
Wait, actually, looking at the options:
- Option D: The data is clustered around 22 - 24 (most dots between 22 - 24), so the mean is around there, and data points are close. Wait, no, wait—wait, maybe I got it wrong. Wait, let's re-express:
Wait, standard deviation is about how spread out the data is. So the data set with data points closest to each other (smallest range and most concentration) will have the lowest standard deviation.
Looking at the four dot plots:
- Option D: Most dots are between 22 - 24, with fewer outliers. Wait, no, wait—actually, let's check the concentration:
Wait, the correct answer is D? No, wait, no—wait, maybe I messed up. Wait, no, let's think again. Wait, the data set with the most data points clustered in a small range. Wait, actually, looking at the dot plots:
- Option D: The dots are mostly between 22 - 24, so the data is concentrated around 22 - 24, so the spread is small. Wait, but maybe I made a mistake. Wait, no, let's check the options again.
Wait, actually, the correct answer is D? No, wait, no—wait, the key is: the data set with the data points closest to each other (i.e., the most concentrated). Let's see:
- Option A: Data from 18 to 28, with dots at 18,19,20,21,23,24,25,26,27,28? Wait, no, the x-axis is 18,20,22,24,26,28 (with marks in between). Wait, the dots:
- Option D: Dots are at 18,21,22,22,22,23,23,23,24,24,26,28. Wait, no, the dot plot for D: x at 18, 21 (wait, no, the x-axis has 18, then a mark, then 20, then a mark, then 22, etc. So each "tick" is 1 unit? Wait, 18, 19, 20, 21, 22, 23, 24, 25, 26, 27, 28. So the dots:
- Option D: 18 (1), 21 (1), 22 (4), 23 (3), 24 (2), 26 (1), 28 (1). So most dots between 22 - 24, so concentrated.
- Option C: Dots at 18,19,20,21,23,24,25,26,27,28? No, the dots for C: 18 (1),19 (1),20 (2),21 (1),23 (1),24 (2),25 (2),26 (1),27 (3),28 (2). So spread from 18 - 28, more spread.
- Option B: Dots at 18 (3),19 (2),20 (3),21 (2),22 (1),23 (1),25 (2),26 (1),27 (1),28 (1). Spread from 18 - 28, more spread.
- Option A: Dots at 18 (3),19 (2),20 (1),21 (1),23 (1),24 (2),25 (1),26 (2),27 (2),28 (1). Spread from 18 - 28, more spread.
Wait, no, actually, the correct answer is D? Wait, no, wait—maybe I had it backwards. Wait, no, the data set with the most concentration (least spread) is D, because most data points are between 22 - 24, so the mean is around there, and data points are close. So the standard deviation is lowest for D.
Wait, but let me confirm: standard deviation is low when data is clustered. So D has data clustered around 22 - 24, so it's the most concentrated, hence lowest standard deviation.

Snap & solve any problem in the app
Get step-by-step solutions on Sovi AI
Photo-based solutions with guided steps
Explore more problems and detailed explanations
D. The data set in option D has the most data points clustered closely together (around 22–24), resulting in the smallest spread (lowest standard deviation) compared to the other options.