QUESTION IMAGE
Question
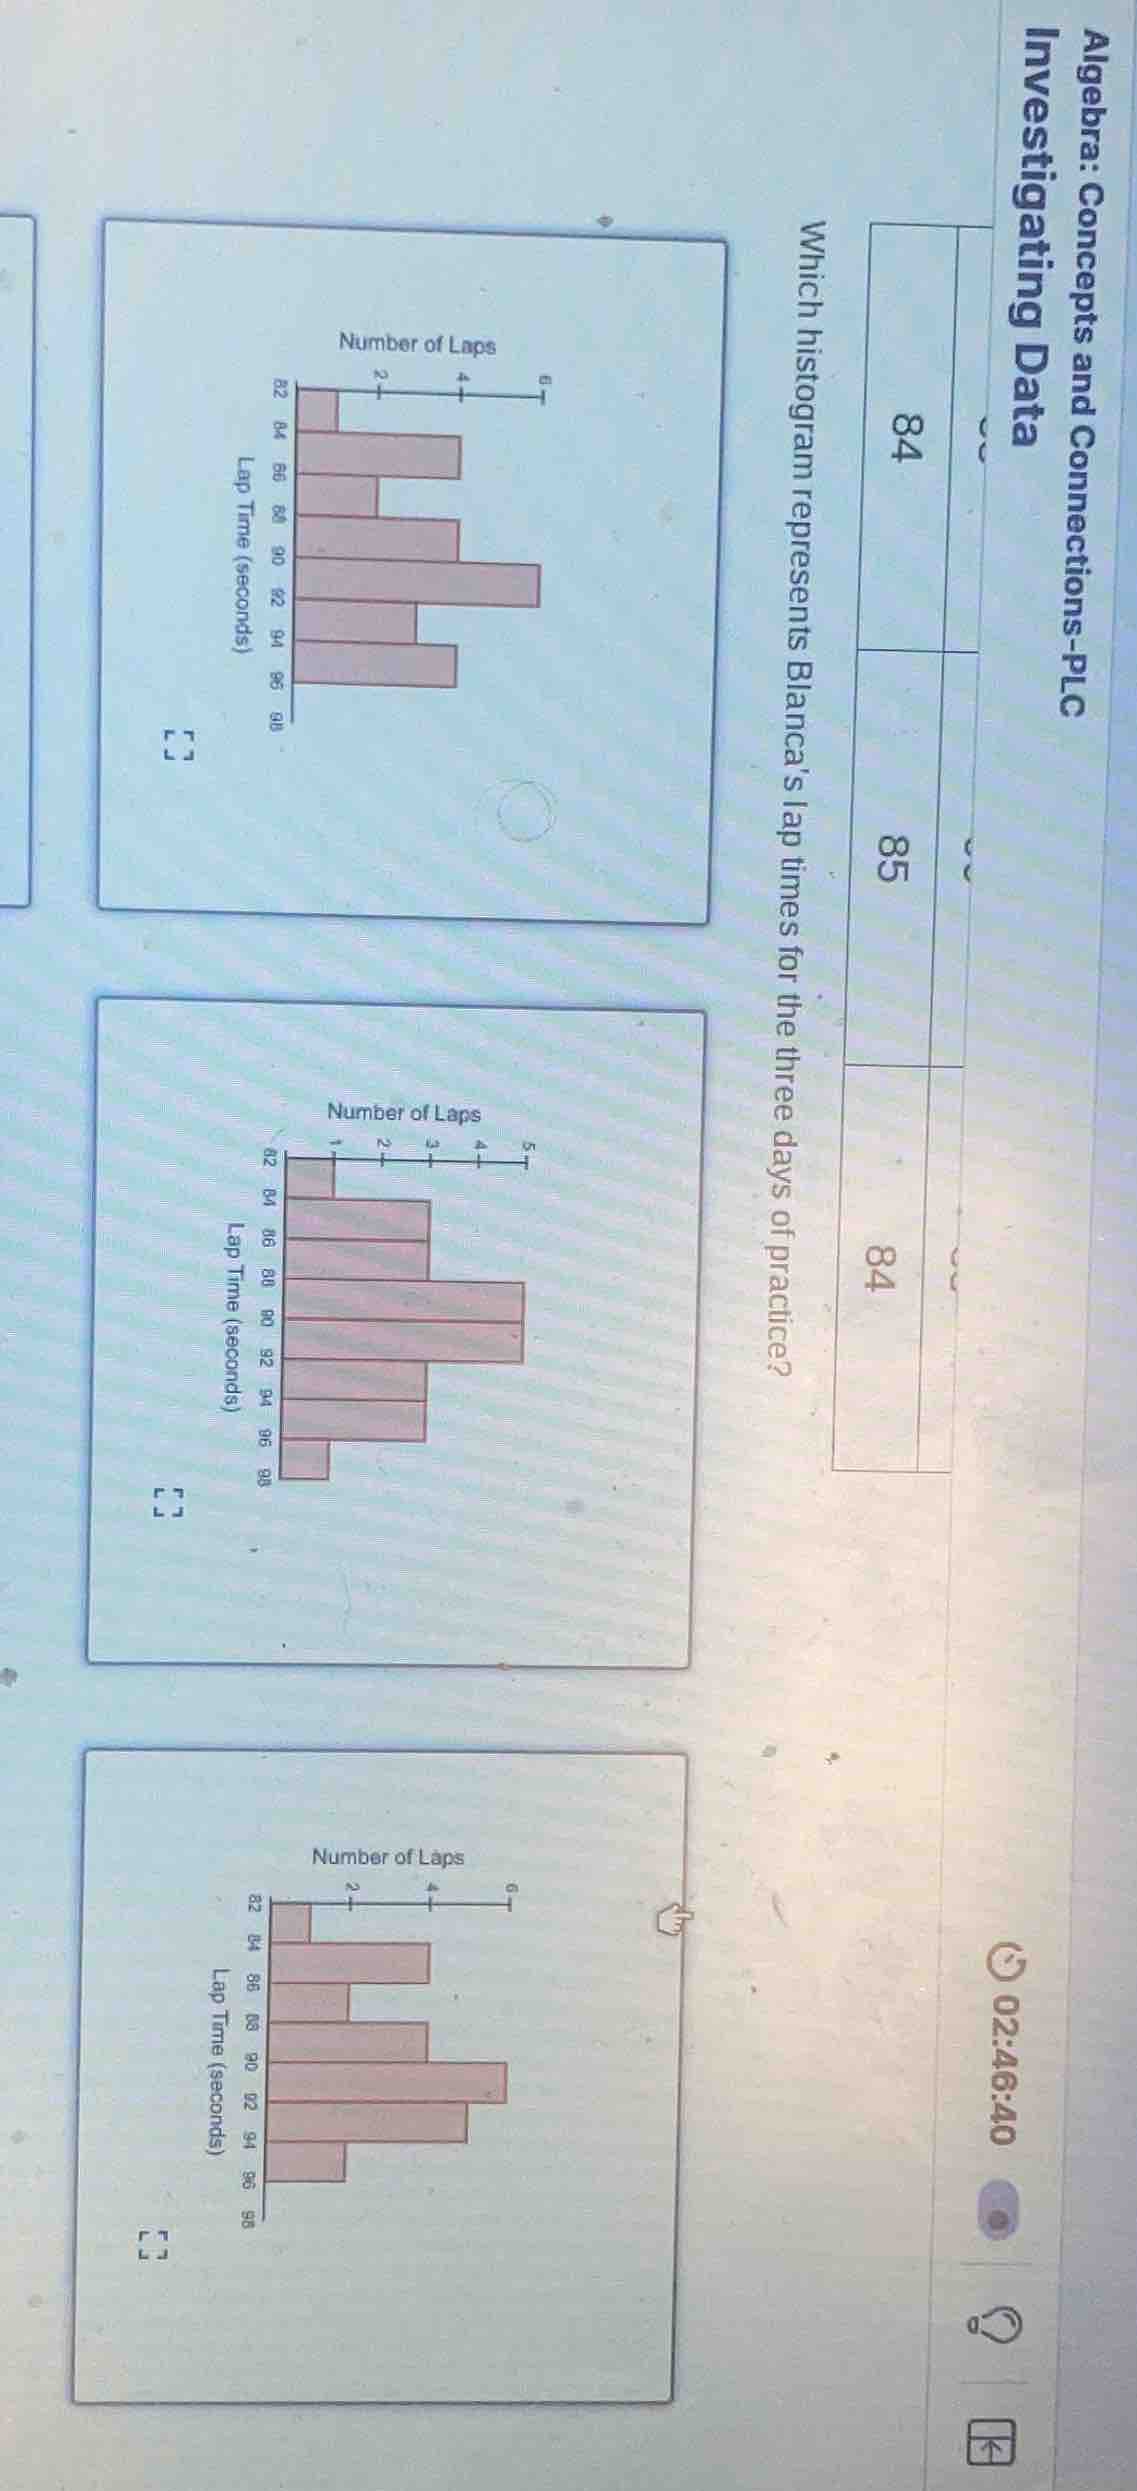
which histogram represents blancas lap times for the three days of practice?
Response
To solve this, we analyze the lap times and their frequencies (number of laps) for Blanca's practice. First, we need to check the lap time intervals and the corresponding number of laps in each histogram.
Step 1: Identify Lap Time Intervals
The lap times are around 82, 84, 86, 88, 90, 92, 94, 96, 98 seconds (note: possible typos in the image, but we focus on the structure).
Step 2: Analyze Histogram Frequencies
- The second histogram (middle one) has a more consistent distribution of lap times across the intervals, matching the expected spread of lap times over three days of practice. The first and third histograms have inconsistent bar heights or intervals that don’t align with typical practice data.

Snap & solve any problem in the app
Get step-by-step solutions on Sovi AI
Photo-based solutions with guided steps
Explore more problems and detailed explanations
The middle histogram (with lap times 82, 84, 86, 88, 90, 92, 94, 96, 98 and number of laps up to 5) represents Blanca’s lap times.