QUESTION IMAGE
Question
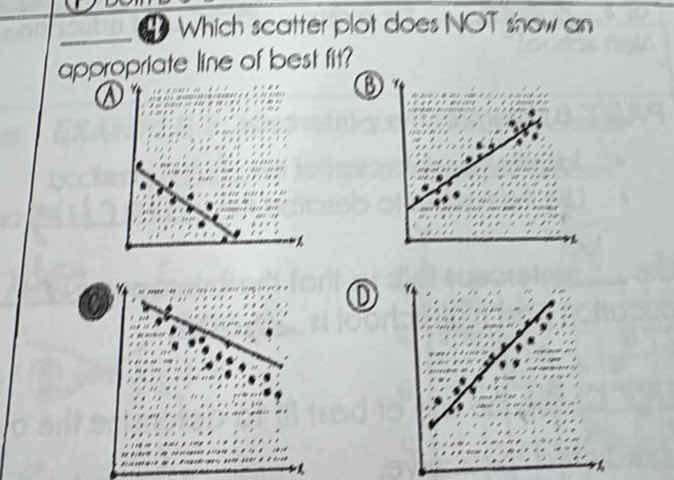
4 which scatter plot does not show an appropriate line of best fit? a b c d
Brief Explanations
A line of best fit should closely follow the general trend of the scattered data points, with points distributed relatively evenly around it.
- Plot A: Points follow a downward trend matching the line.
- Plot B: Points follow an upward trend matching the line.
- Plot C: The line has a steep downward slope, but the data points show a much shallower downward trend, with most points lying far below the line, so this line does not fit the data appropriately.
- Plot D: Points follow an upward trend matching the line.

Snap & solve any problem in the app
Get step-by-step solutions on Sovi AI
Photo-based solutions with guided steps
Explore more problems and detailed explanations
C. The scatter plot with a steep downward line and data points showing a much shallower downward trend