QUESTION IMAGE
Question
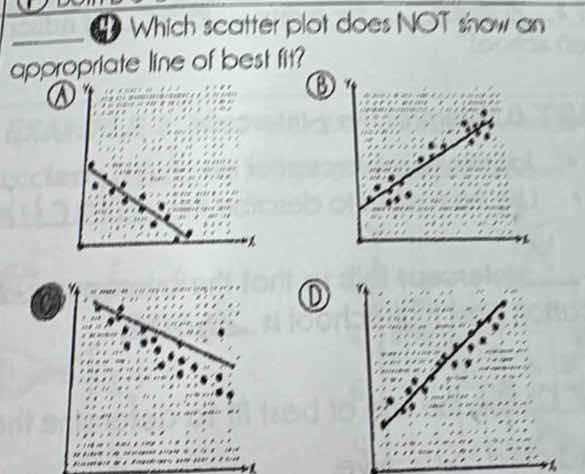
4 which scatter plot does not show an appropriate line of best fit? a b c d
Brief Explanations
To determine which scatter plot does not show an appropriate line of best fit, we analyze the trend of the data points relative to the line. A line of best fit should represent the general trend of the data (positive or negative correlation) and most points should be close to or follow the line's direction.
- In option A, the line has a negative slope, and the points generally follow that downward trend.
- In option B, the line has a positive slope, and the points cluster around it, showing a positive correlation.
- In option D, the line has a positive slope, and the points closely follow the line, indicating a strong positive correlation.
- In option C, the line has a negative slope, but there are many points that deviate significantly from the line's trend (e.g., some points are far above or below the line, and the overall distribution of points does not consistently follow the line's direction as well as the others). Thus, option C does not have an appropriate line of best fit.

Snap & solve any problem in the app
Get step-by-step solutions on Sovi AI
Photo-based solutions with guided steps
Explore more problems and detailed explanations
C