QUESTION IMAGE
Question
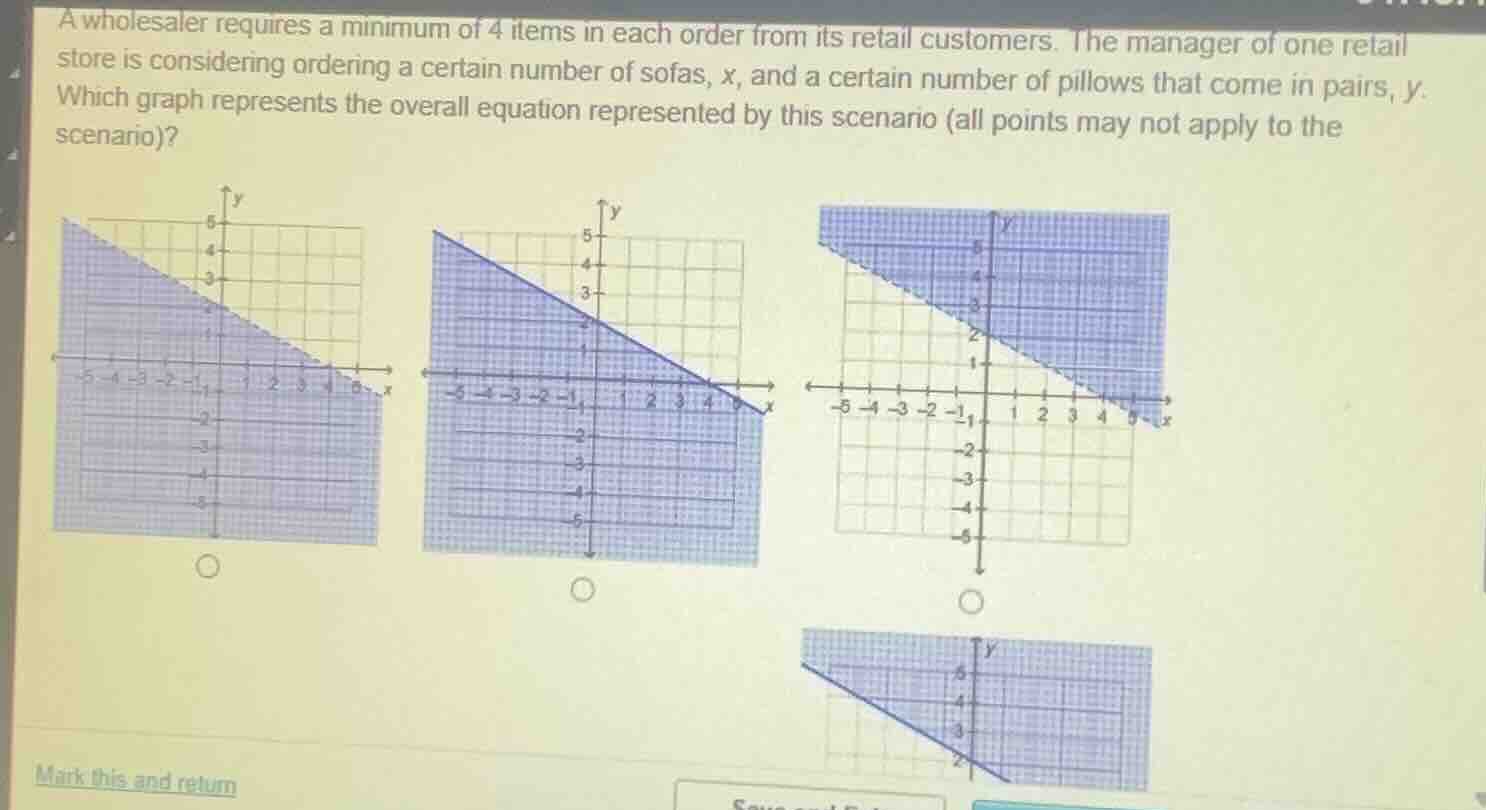
a wholesaler requires a minimum of 4 items in each order from its retail customers. the manager of one retail store is considering ordering a certain number of sofas, x, and a certain number of pillows that come in pairs, y. which graph represents the overall equation represented by this scenario (all points may not apply to the scenario)?
Step1: Define total items equation
Each pillow order is a pair, so total pillows are $2y$. Total items: $x + 2y \geq 4$
Step2: Rearrange to slope-intercept form
Isolate $y$:
$2y \geq -x + 4$
$y \geq -\frac{1}{2}x + 2$
Step3: Analyze graph properties
- Boundary line: $y = -\frac{1}{2}x + 2$, which has y-intercept $(0,2)$ and x-intercept $(4,0)$, solid line (since $\geq$).
- Shading: Above the line (since $y \geq$), and $x,y \geq 0$ (can't order negative items).

Snap & solve any problem in the app
Get step-by-step solutions on Sovi AI
Photo-based solutions with guided steps
Explore more problems and detailed explanations
The bottom-right graph (with shading above the solid line $y = -\frac{1}{2}x + 2$, restricted to non-negative $x,y$)