QUESTION IMAGE
Question
our world is filled with an incredible array of life forms, from tiny insects to towering trees. while some parts of the planet are home to a wide variety of species, others are less diverse. factors such as a warm climate and a high rate of photosynthesis enhance an area’s biodiversity. that’s why brazil, peru, and colombia, latin american nations that contain large stretches of the amazon rainforest, have some of the greatest biodiversity in the world. deserts, especially cold deserts like those in antarctica and central asia’s gobi basin, have lower biodiversity due to their extreme temperatures and limited resources.
unfortunately, due to an increasing human population, overconsumption of resources, and climate change, biodiversity is declining in most places. the expansion of agriculture, both to graze more cattle for meat and to grow more crops for the production of goods, has led to deforestation. as humans use more resources, we also destroy the habitats that sustain biodiversity.
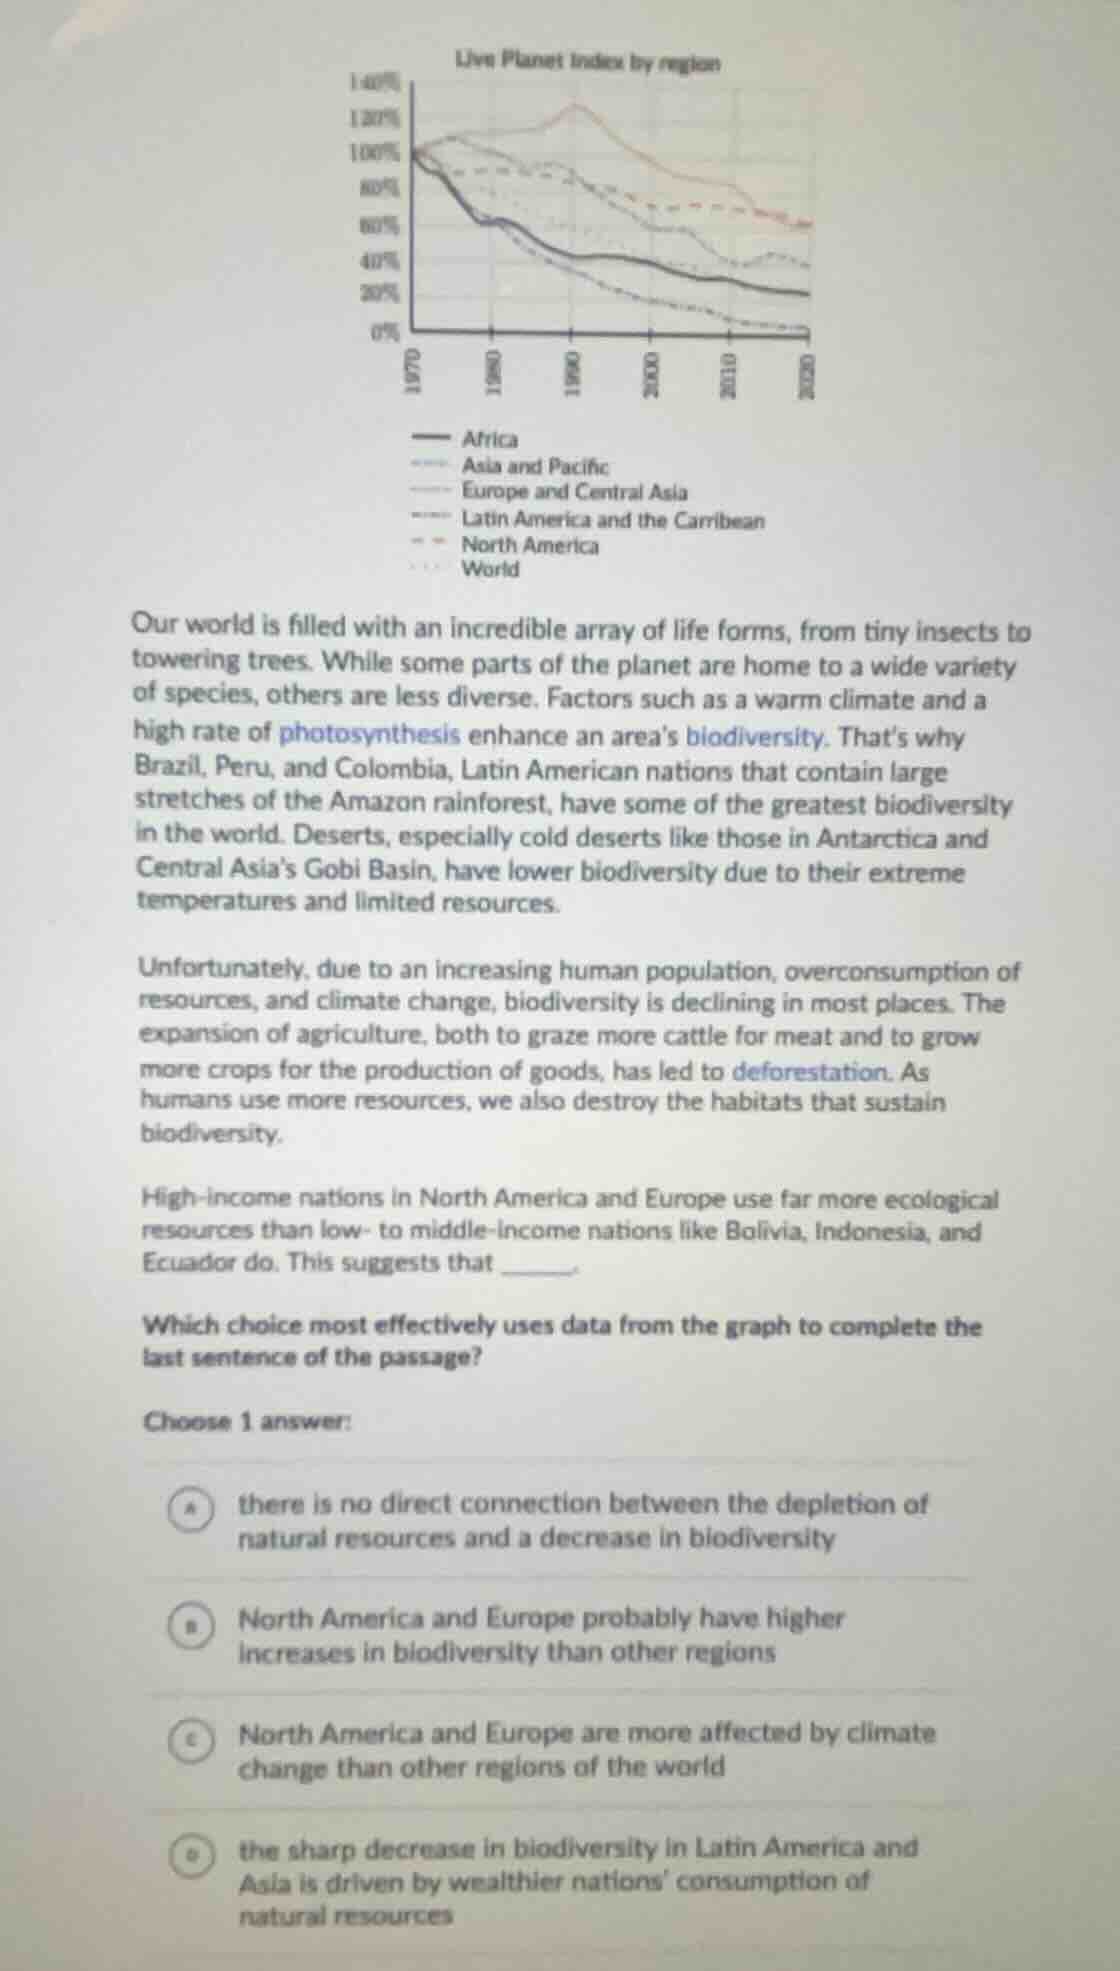
high - income nations in north america and europe use far more ecological resources than low - to middle - income nations like bolivia, indonesia, and ecuador do. this suggests that ______.
which choice most effectively uses data from the graph to complete the last sentence of the passage?
choose 1 answer:
a there is no direct connection between the depletion of natural resources and a decrease in biodiversity
b north america and europe probably have higher increases in biodiversity than other regions
c north america and europe are more affected by climate change than other regions of the world
d the sharp decrease in biodiversity in latin america and asia is driven by wealthier nations’ consumption of natural resources
- Option A: The passage states biodiversity is declining due to resource use, so there is a connection, eliminating A.
- Option B: The graph likely shows declines, and high - resource use nations (NA, Europe) wouldn't have higher biodiversity increases, eliminating B.
- Option C: The passage and graph focus on resource use and biodiversity, not climate change impact comparison, eliminating C.
- Option D: High - income nations (NA, Europe) use more resources. The graph (Living Planet Index) likely shows sharp biodiversity drops in Latin America and Asia. So wealthier nations' resource consumption could drive this decline, which fits.

Snap & solve any problem in the app
Get step-by-step solutions on Sovi AI
Photo-based solutions with guided steps
Explore more problems and detailed explanations
D. the sharp decrease in biodiversity in Latin America and Asia is driven by wealthier nations’ consumption of natural resources