QUESTION IMAGE
Question
as you answer the questions below, consider how the two variables are related to each other in the real world.
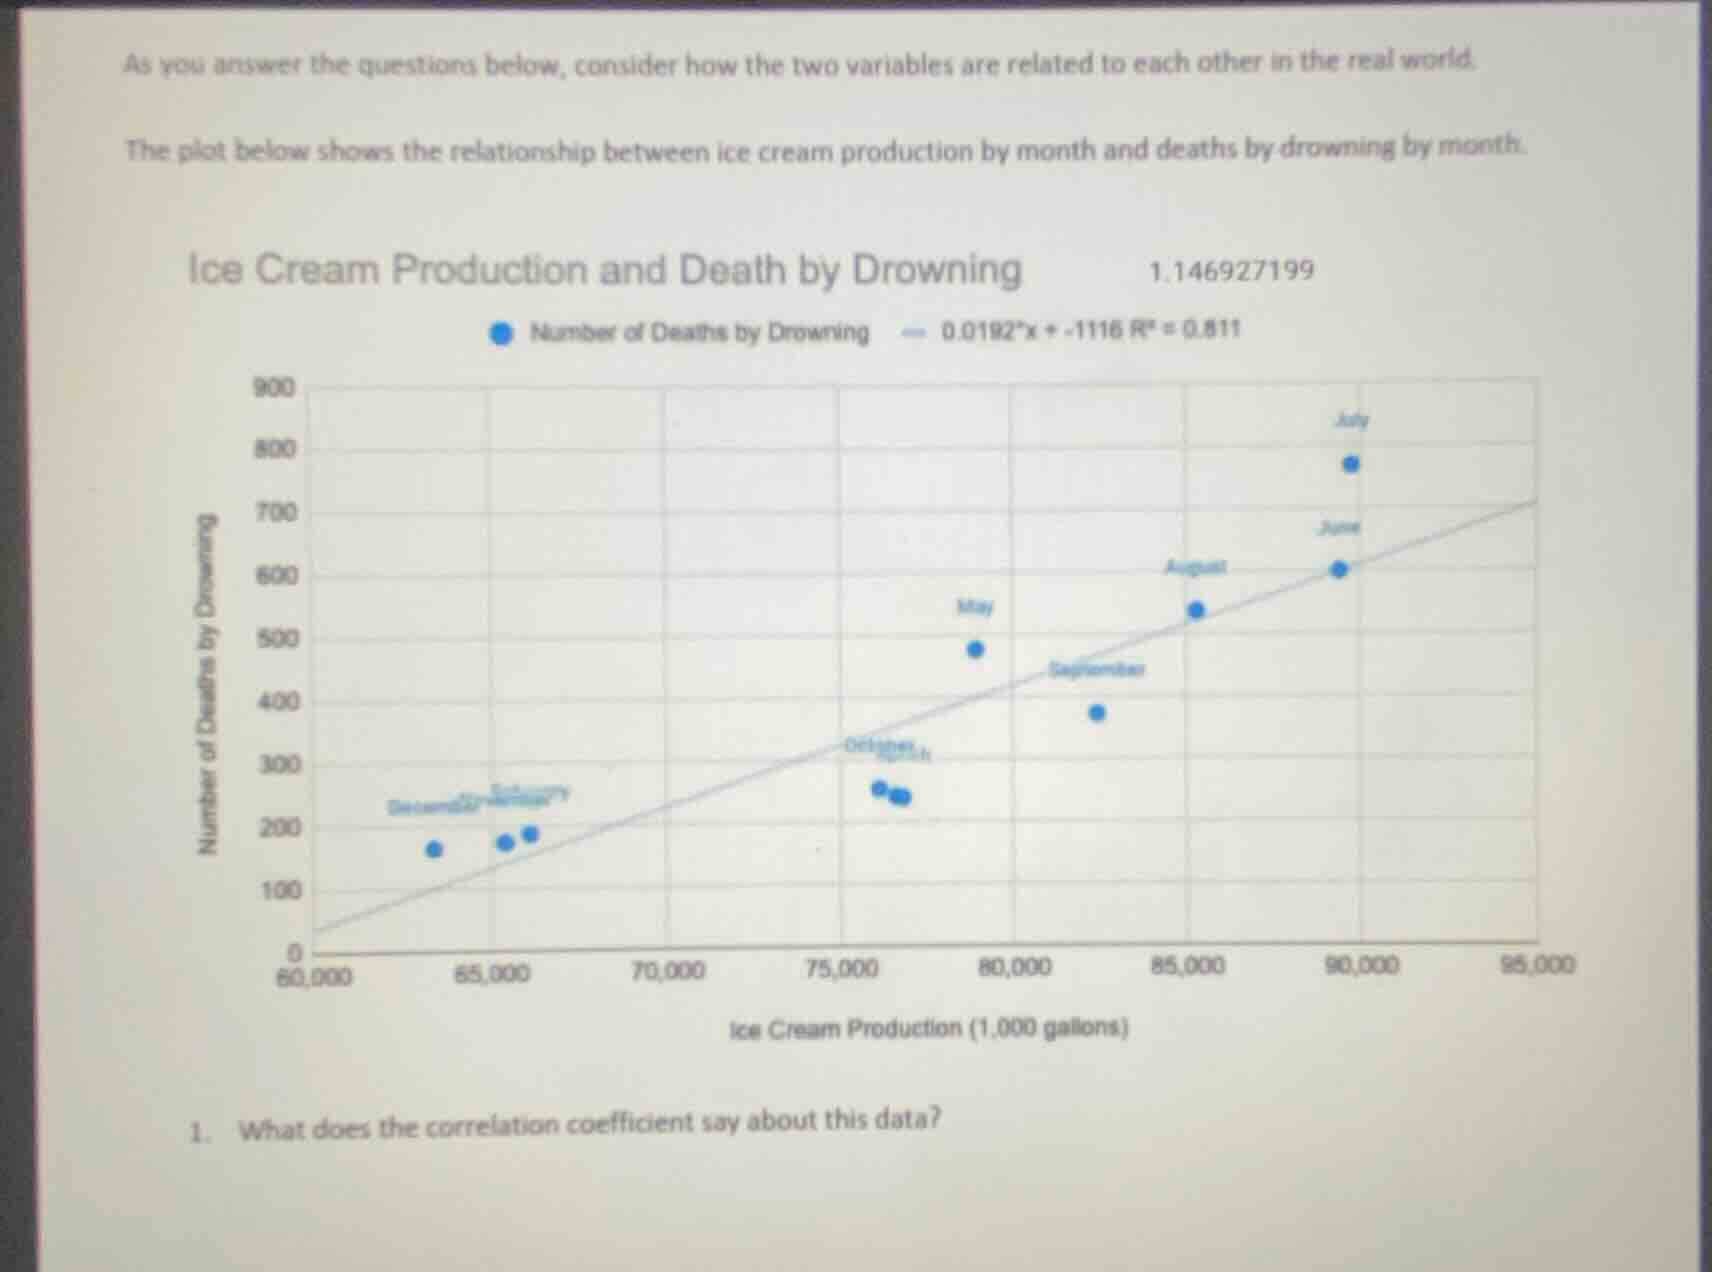
the plot below shows the relationship between ice cream production by month and deaths by drowning by month.
ice cream production and death by drowning 1.146927199
number of deaths by drowning 0.0192*x + -1116 r² = 0.811
- what does the correlation coefficient say about this data?
First, calculate the correlation coefficient $r$ from the given $R^2 = 0.811$. The correlation coefficient is the square root of $R^2$, so $r = \sqrt{0.811} \approx 0.901$. A correlation coefficient close to +1 indicates a strong positive linear relationship between the two variables. This means as monthly ice cream production increases, monthly drowning deaths tend to increase, though this does not mean one causes the other (it is likely a third variable like warm weather driving both).

Snap & solve any problem in the app
Get step-by-step solutions on Sovi AI
Photo-based solutions with guided steps
Explore more problems and detailed explanations
The correlation coefficient (≈0.901) indicates a strong positive linear relationship between monthly ice cream production and monthly drowning deaths: as ice cream production rises, drowning deaths tend to rise as well.