QUESTION IMAGE
Question
graph the following function on the axes provided.
$f(x) = \
$
click and drag to make a line. click the line to delete it.
click on an endpoint of a line to change it.
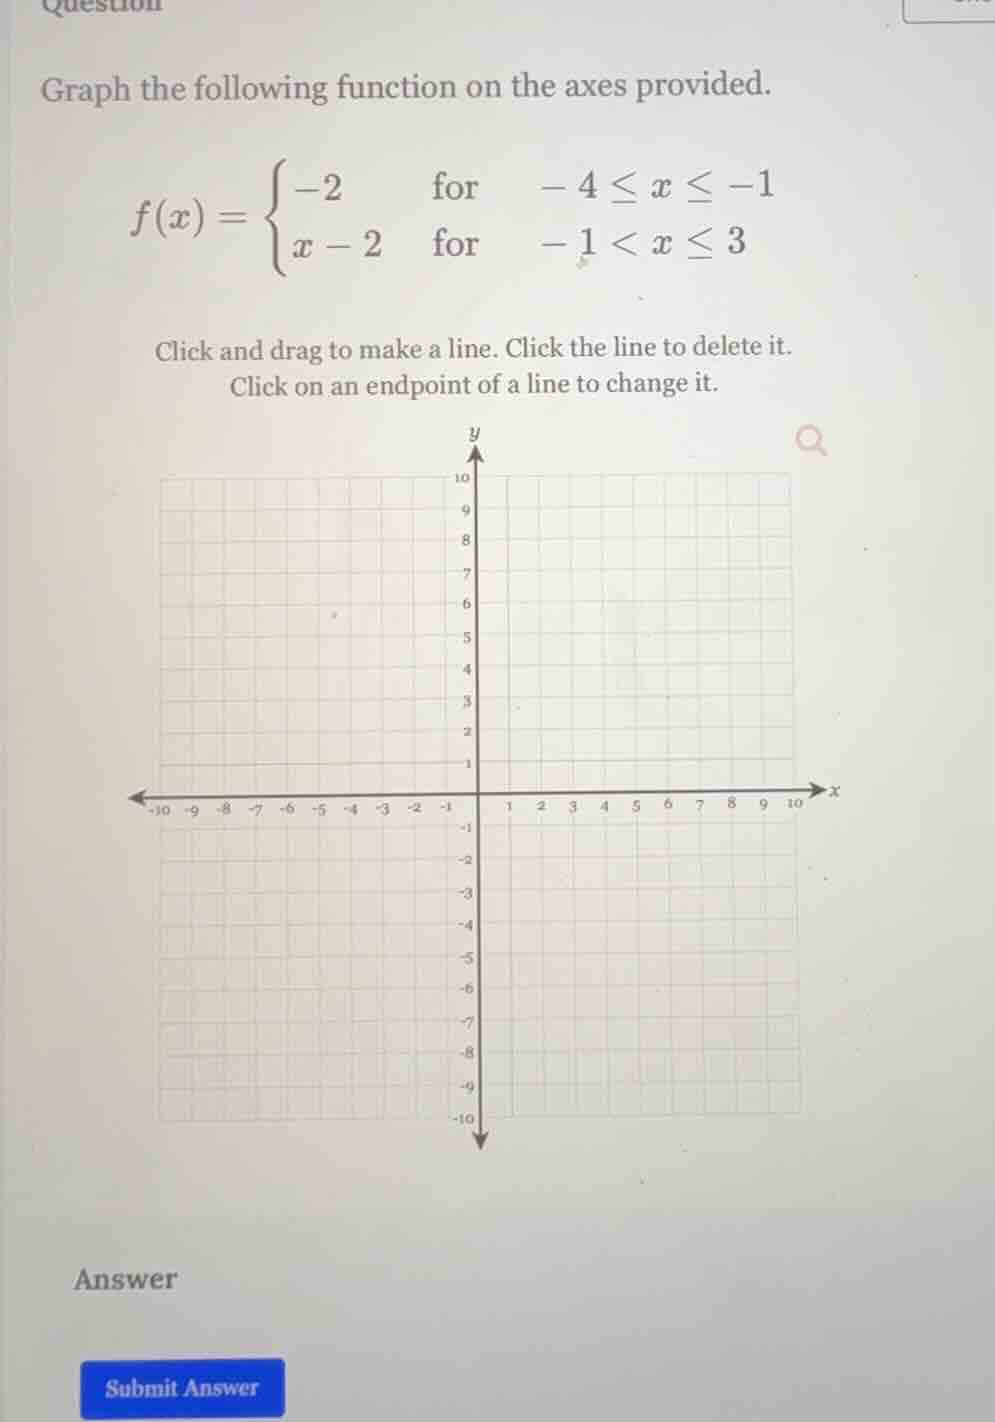
(there is a coordinate plane graph here, with x - axis from - 10 to 10 and y - axis from - 10 to 10, with grid lines.)
answer
submit answer
Step1: Graph the first piece ($f(x) = -2$, $-4 \leq x \leq -1$)
This is a horizontal line. Find the endpoints: when $x = -4$, $f(-4) = -2$; when $x = -1$, $f(-1) = -2$. So plot the points $(-4, -2)$ and $(-1, -2)$ and draw a horizontal line segment between them. The endpoint at $x = -1$ is closed (since the inequality is $\leq$), so it's a solid dot.
Step2: Graph the second piece ($f(x) = x - 2$, $-1 < x \leq 3$)
This is a linear function. Find two points: when $x = -1$ (open circle, since $x > -1$), $f(-1) = -1 - 2 = -3$ (open dot at $(-1, -3)$); when $x = 3$, $f(3) = 3 - 2 = 1$ (closed dot at $(3, 1)$). Also, we can find another point, e.g., when $x = 0$, $f(0) = 0 - 2 = -2$ (point $(0, -2)$). Draw a line segment from the open dot at $(-1, -3)$ through $(0, -2)$ to the closed dot at $(3, 1)$.

Snap & solve any problem in the app
Get step-by-step solutions on Sovi AI
Photo-based solutions with guided steps
Explore more problems and detailed explanations
To graph the piecewise function:
- For \( -4 \leq x \leq -1 \): Draw a horizontal line segment between \( (-4, -2) \) (closed dot) and \( (-1, -2) \) (closed dot).
- For \( -1 < x \leq 3 \): Draw a line segment from the open dot at \( (-1, -3) \) through \( (0, -2) \) (or other points) to the closed dot at \( (3, 1) \).
(Note: In the interactive graph, use click-and-drag to create these segments, adjusting endpoints as needed.)