QUESTION IMAGE
Question
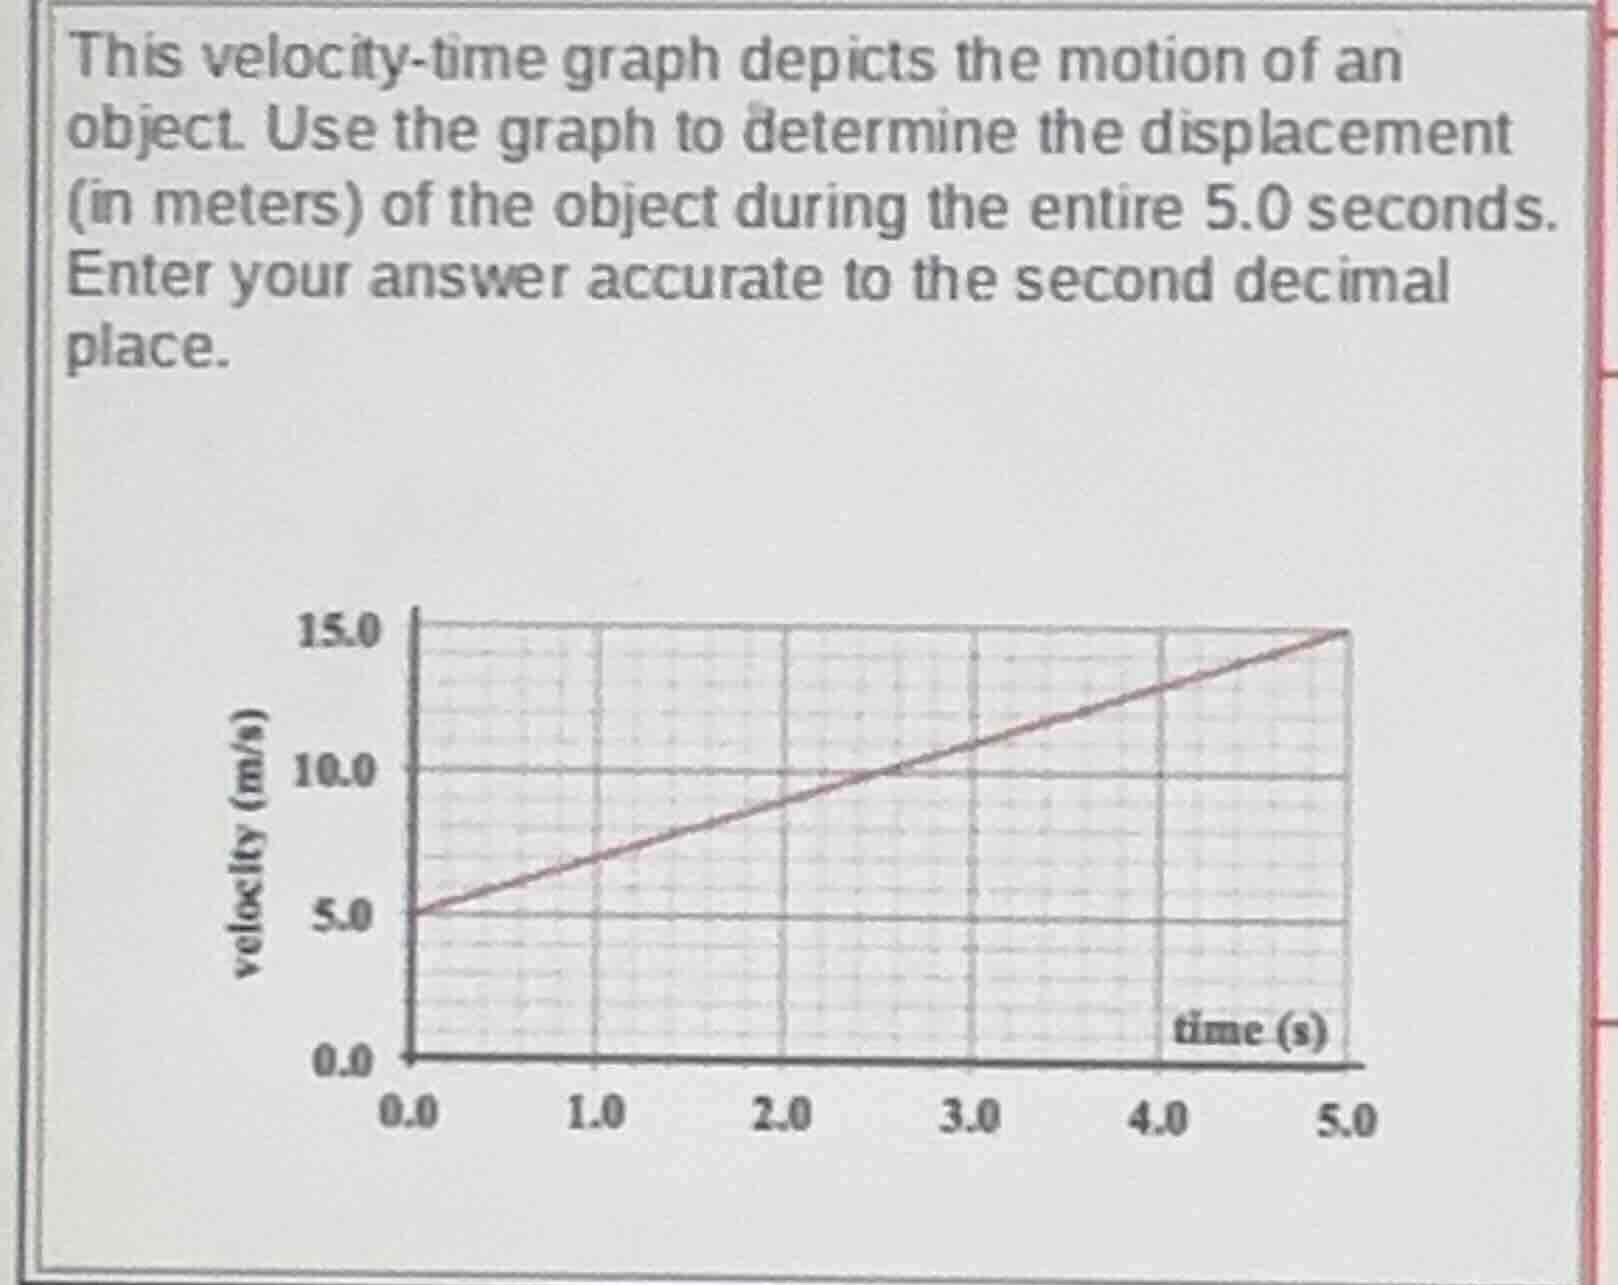
this velocity-time graph depicts the motion of an object. use the graph to determine the displacement (in meters) of the object during the entire 5.0 seconds. enter your answer accurate to the second decimal place.
Step1: Identify graph shape (trapezoid)
The velocity-time graph is a trapezoid with two parallel sides (initial velocity $v_0=5.0\ \text{m/s}$, final velocity $v_f=15.0\ \text{m/s}$) and base $t=5.0\ \text{s}$.
Step2: Use trapezoid area formula
Displacement = area of trapezoid: $\text{Displacement} = \frac{1}{2} \times (v_0 + v_f) \times t$
Step3: Substitute values and calculate
$\text{Displacement} = \frac{1}{2} \times (5.0 + 15.0) \times 5.0 = \frac{1}{2} \times 20.0 \times 5.0 = 50.00$

Snap & solve any problem in the app
Get step-by-step solutions on Sovi AI
Photo-based solutions with guided steps
Explore more problems and detailed explanations
50.00