QUESTION IMAGE
Question
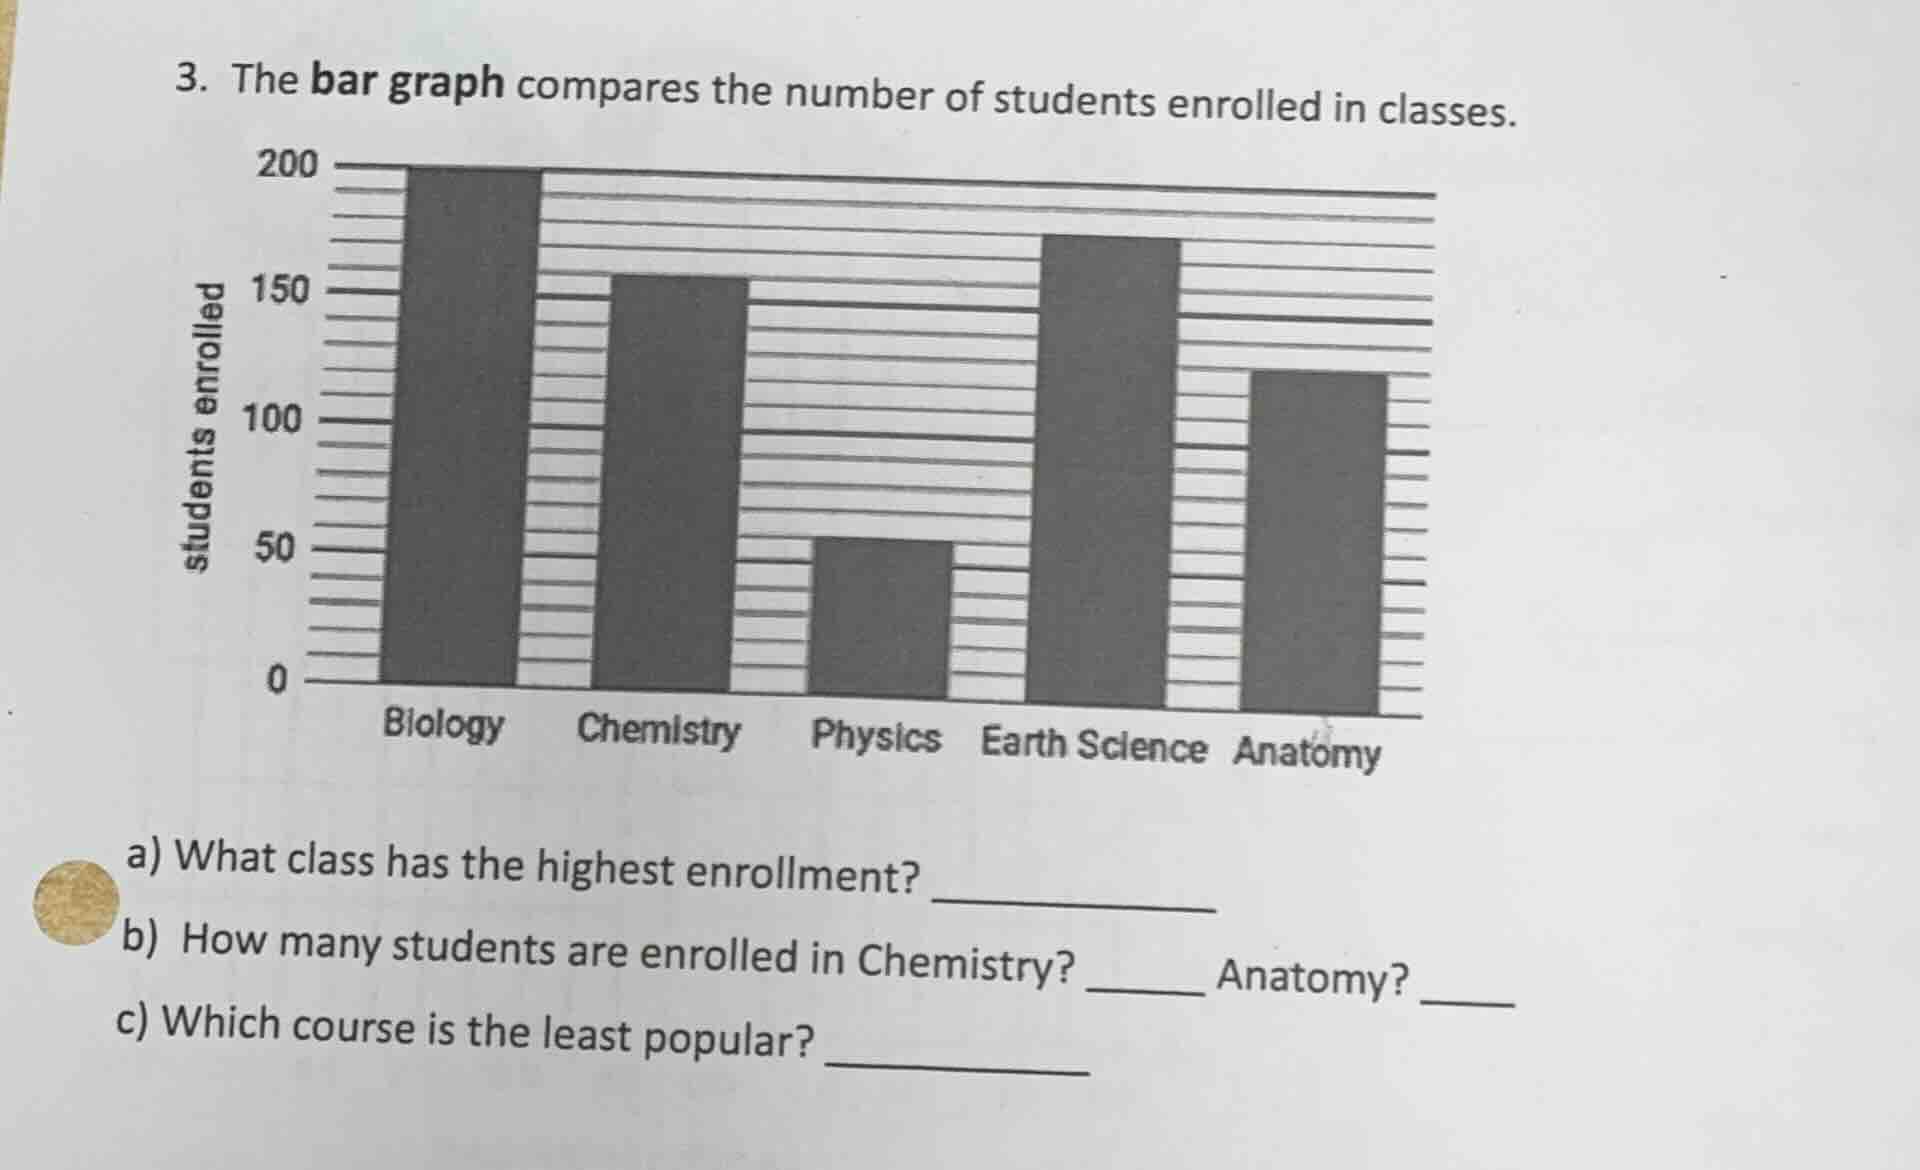
- the bar graph compares the number of students enrolled in classes.
a) what class has the highest enrollment?
b) how many students are enrolled in chemistry? anatomy?
c) which course is the least popular?
Brief Explanations
a) Identify the tallest bar in the graph, which corresponds to the class with the highest enrollment.
b) Match the height of the Chemistry and Anatomy bars to the y-axis values for student enrollment.
c) Identify the shortest bar in the graph, which corresponds to the least popular course.

Snap & solve any problem in the app
Get step-by-step solutions on Sovi AI
Photo-based solutions with guided steps
Explore more problems and detailed explanations
a) Biology
b) Chemistry: 150; Anatomy: 120
c) Physics