QUESTION IMAGE
Question
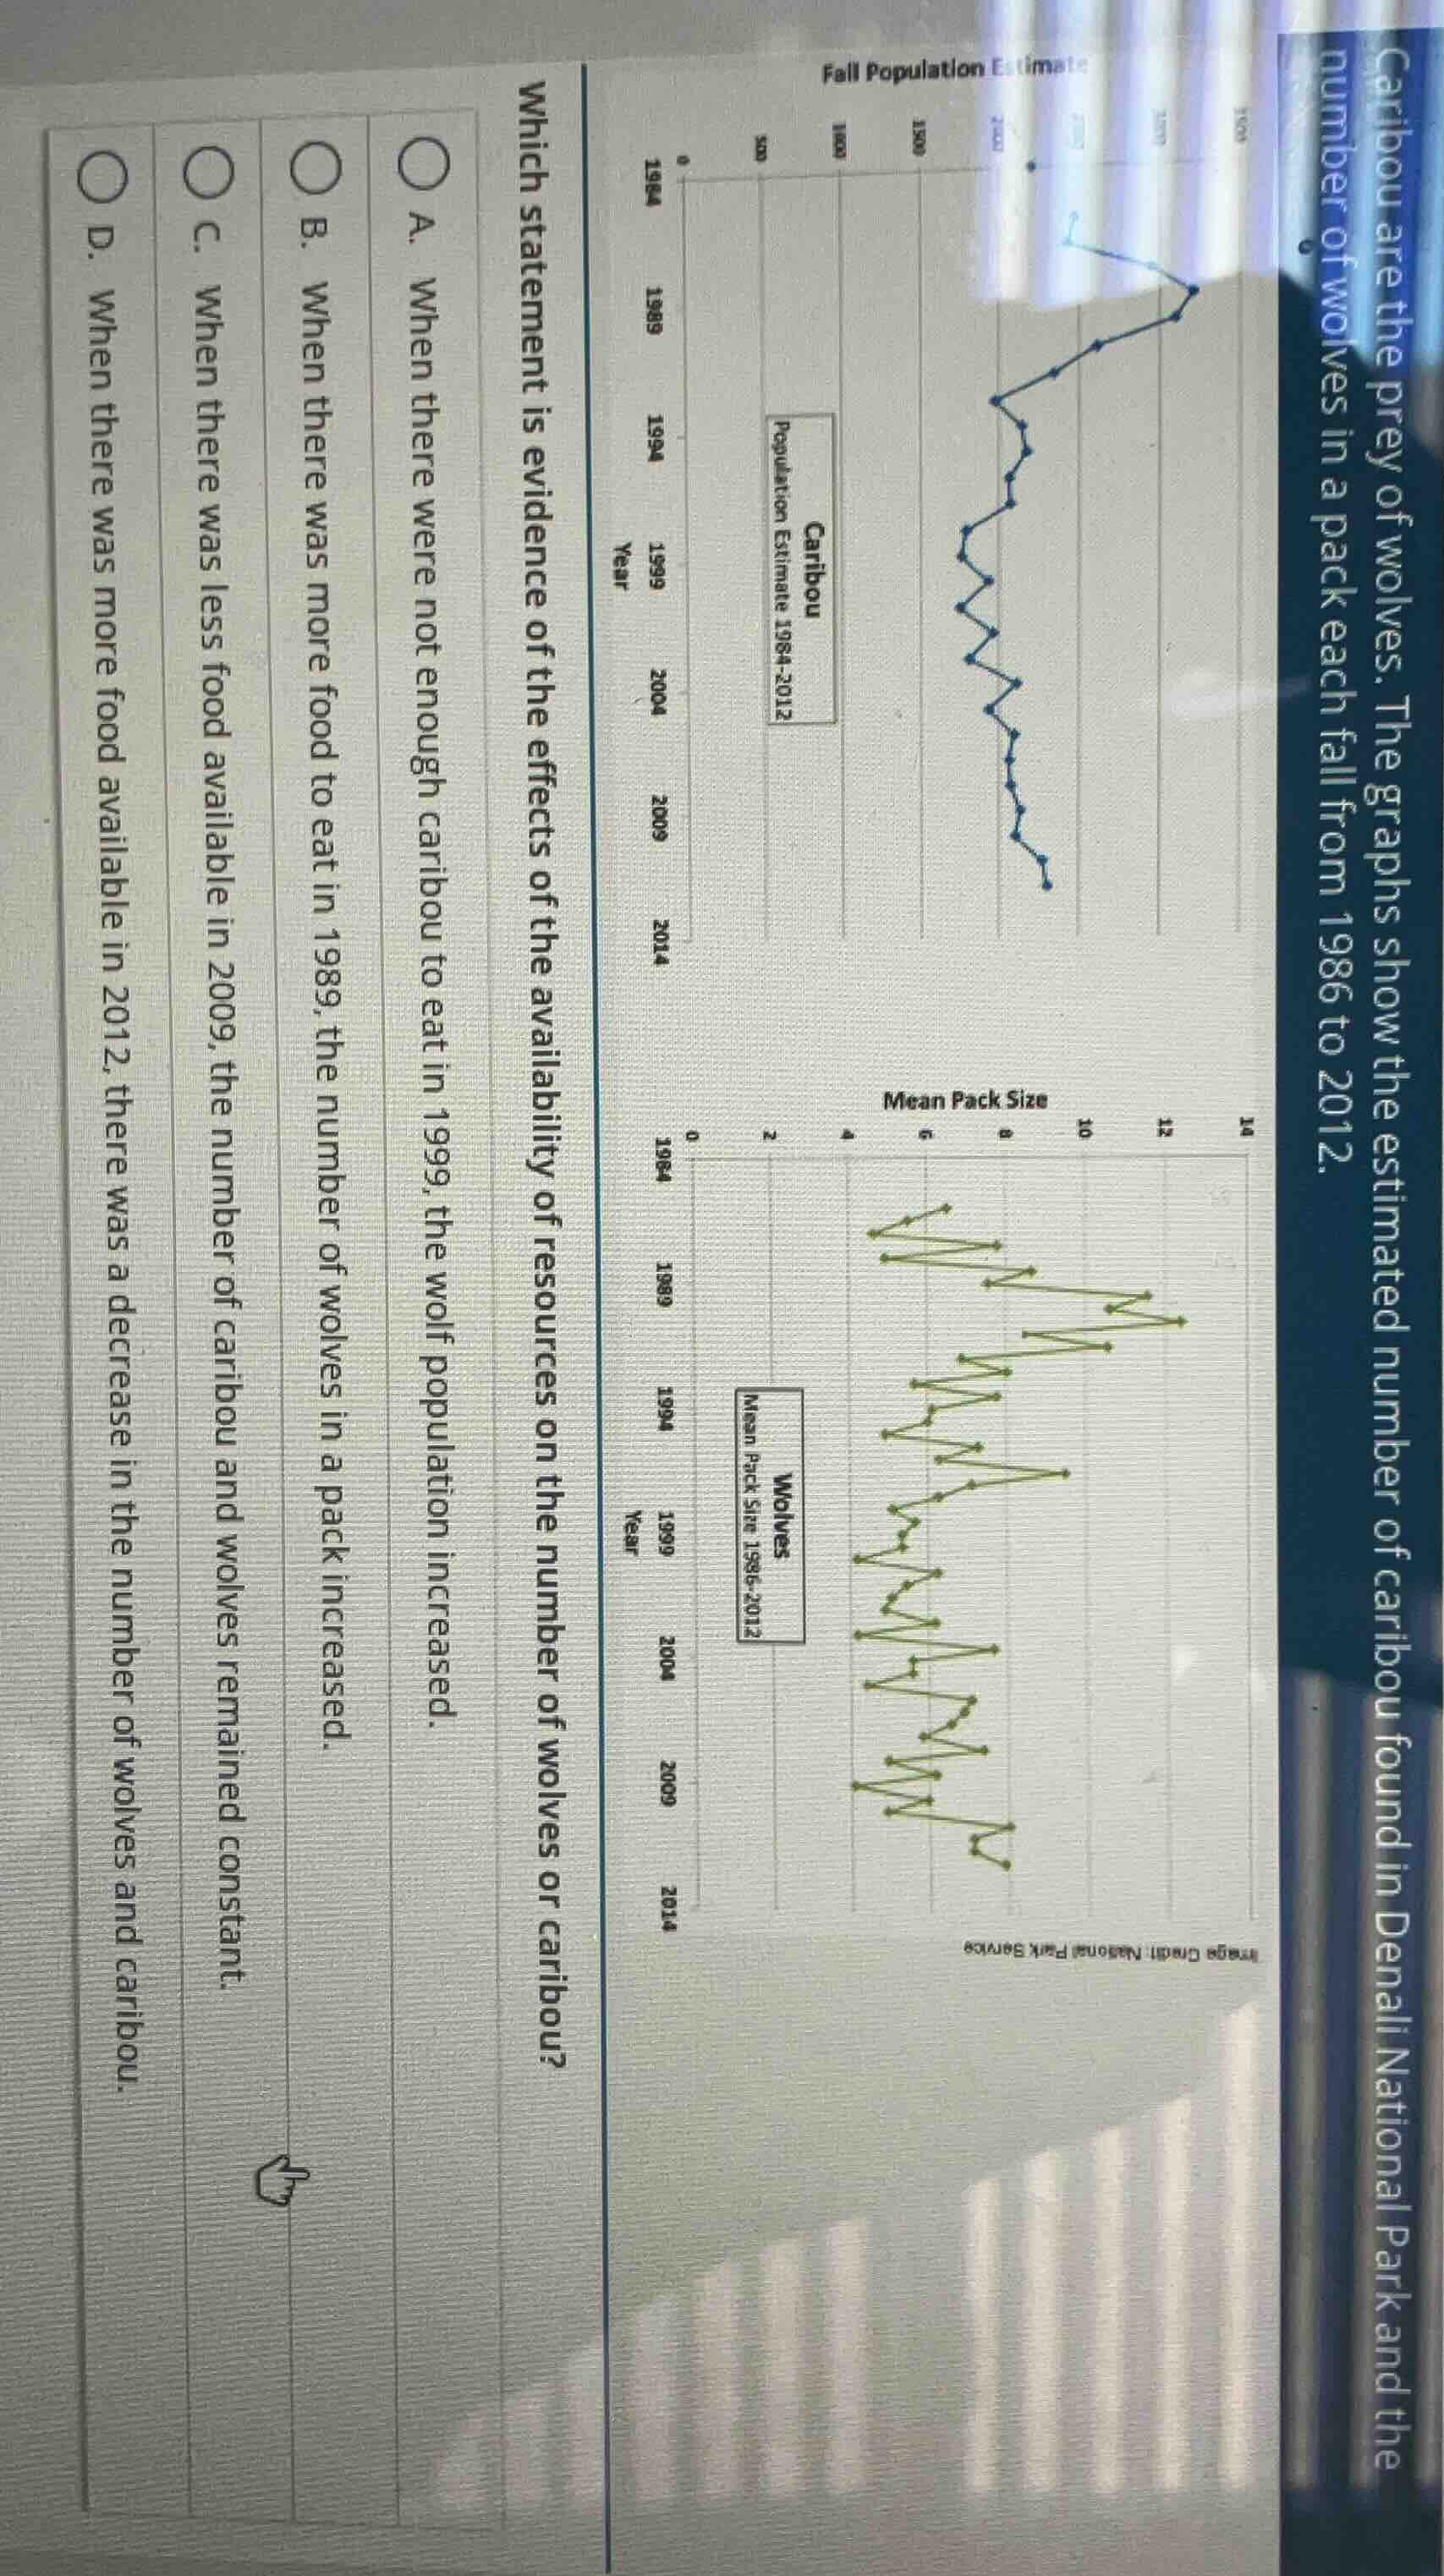
caribou are the prey of wolves. the graphs show the estimated number of caribou found in denali national park and the number of wolves in a pack each fall from 1986 to 2012.
which statement is evidence of the effects of the availability of resources on the number of wolves or caribou?
a. when there were not enough caribou to eat in 1999, the wolf population increased.
b. when there was more food to eat in 1989, the number of wolves in a pack increased.
c. when there was less food available in 2009, the number of caribou and wolves remained constant.
d. when there was more food available in 2012, there was a decrease in the number of wolves and caribou.
- Option A: In 1999, the caribou population (from the first graph) seems to be relatively low (not enough food for wolves). The wolf pack size (second graph) around 1999—if we analyze the trend, when prey (caribou) is scarce, wolf population dynamics: but actually, let's check the graphs. Wait, the first graph is caribou population (y - axis: 0, 500, 1000, 1500, 2000, 2500, 3000, 3500; years 1984 - 2012). In 1999, caribou population—looking at the line, maybe lower. The wolf mean pack size (second graph, y - axis 0 - 14, years 1986 - 2012). If caribou are prey, when caribou are not enough (prey scarce), wolf population (pack size) might not increase. So A is wrong.
- Option B: 1989—caribou population (first graph) in 1989: let's see the caribou line. In 1989, caribou population—maybe around, say, 2000? The wolf pack size in 1989: the second graph, the line in 1989—if caribou (food) is more, wolf pack size: but the wolf pack size graph in 1989—looking at the green line, maybe it's not an increase. Wait, maybe I misread. Wait, the question is about resource (food, caribou) availability affecting wolf or caribou numbers. Let's re - evaluate:
- Option C: 2009—caribou population (first graph) in 2009: the caribou line in 2009—maybe lower (less food for wolves? Wait, no—if caribou are prey, less caribou means less food for wolves. But the option says "when there was less food available in 2009, the number of caribou and wolves remained constant." But from the graphs, caribou population is changing, wolf pack size is changing. So C is wrong.
- Option D: 2012—caribou population (first graph) in 2012: looking at the caribou line, it's lower? Wait, no—wait the first graph's y - axis: maybe the caribou population in 2012 is lower? Wait, no, maybe I got the graphs reversed. Wait, the first graph is caribou population (fall population estimate 1984 - 2012). The second is wolf mean pack size (1986 - 2012). Wait, in 2012, caribou population—let's see the blue line. If in 2012, caribou population is higher (more food), but the caribou line in 2012—wait the blue line in 2012: maybe it's decreasing? No, wait the user's graph: "Caribou are the prey of wolves. The graphs show the estimated number of caribou found in Denali National Park and the number of wolves in a pack each fall from 1986 to 2012." Wait, maybe the first graph (caribou) has a peak, then declines. The second (wolf pack size) has fluctuations. Wait, in 2012, if caribou population is lower (less food), but the option D says "when there was more food available in 2012, there was a decrease in the number of wolves and caribou." No, that doesn't make sense. Wait, maybe I made a mistake. Wait, let's re - analyze the correct option. Wait, maybe the correct answer is D? No, wait—wait the key is to see the relationship between prey (caribou) and predator (wolves). When food (caribou) is more, what happens? Wait, maybe the caribou population in 2012—if the caribou line in 2012 is lower (less food), but the option D says "more food". Wait, I think I messed up. Wait, let's look at the graphs again (as per the image description):
First graph (caribou): blue line, years 1984 - 2012, y - axis population. The line has a peak (around, say, 2000 - 2005) then declines. Second graph (wolves: mean pack size): green line, years 1986 - 2012, y - axis pack size. It has fluctuations, maybe a general decline?
Wait, option D: "when there was more food available in 2012, there was a decrease in the number of wolves and caribou." Wait, if in 2012, caribou population (food) is more (but the caribou line in 2012—ma…

Snap & solve any problem in the app
Get step-by-step solutions on Sovi AI
Photo-based solutions with guided steps
Explore more problems and detailed explanations
D. when there was more food available in 2012, there was a decrease in the number of wolves and caribou