QUESTION IMAGE
Question
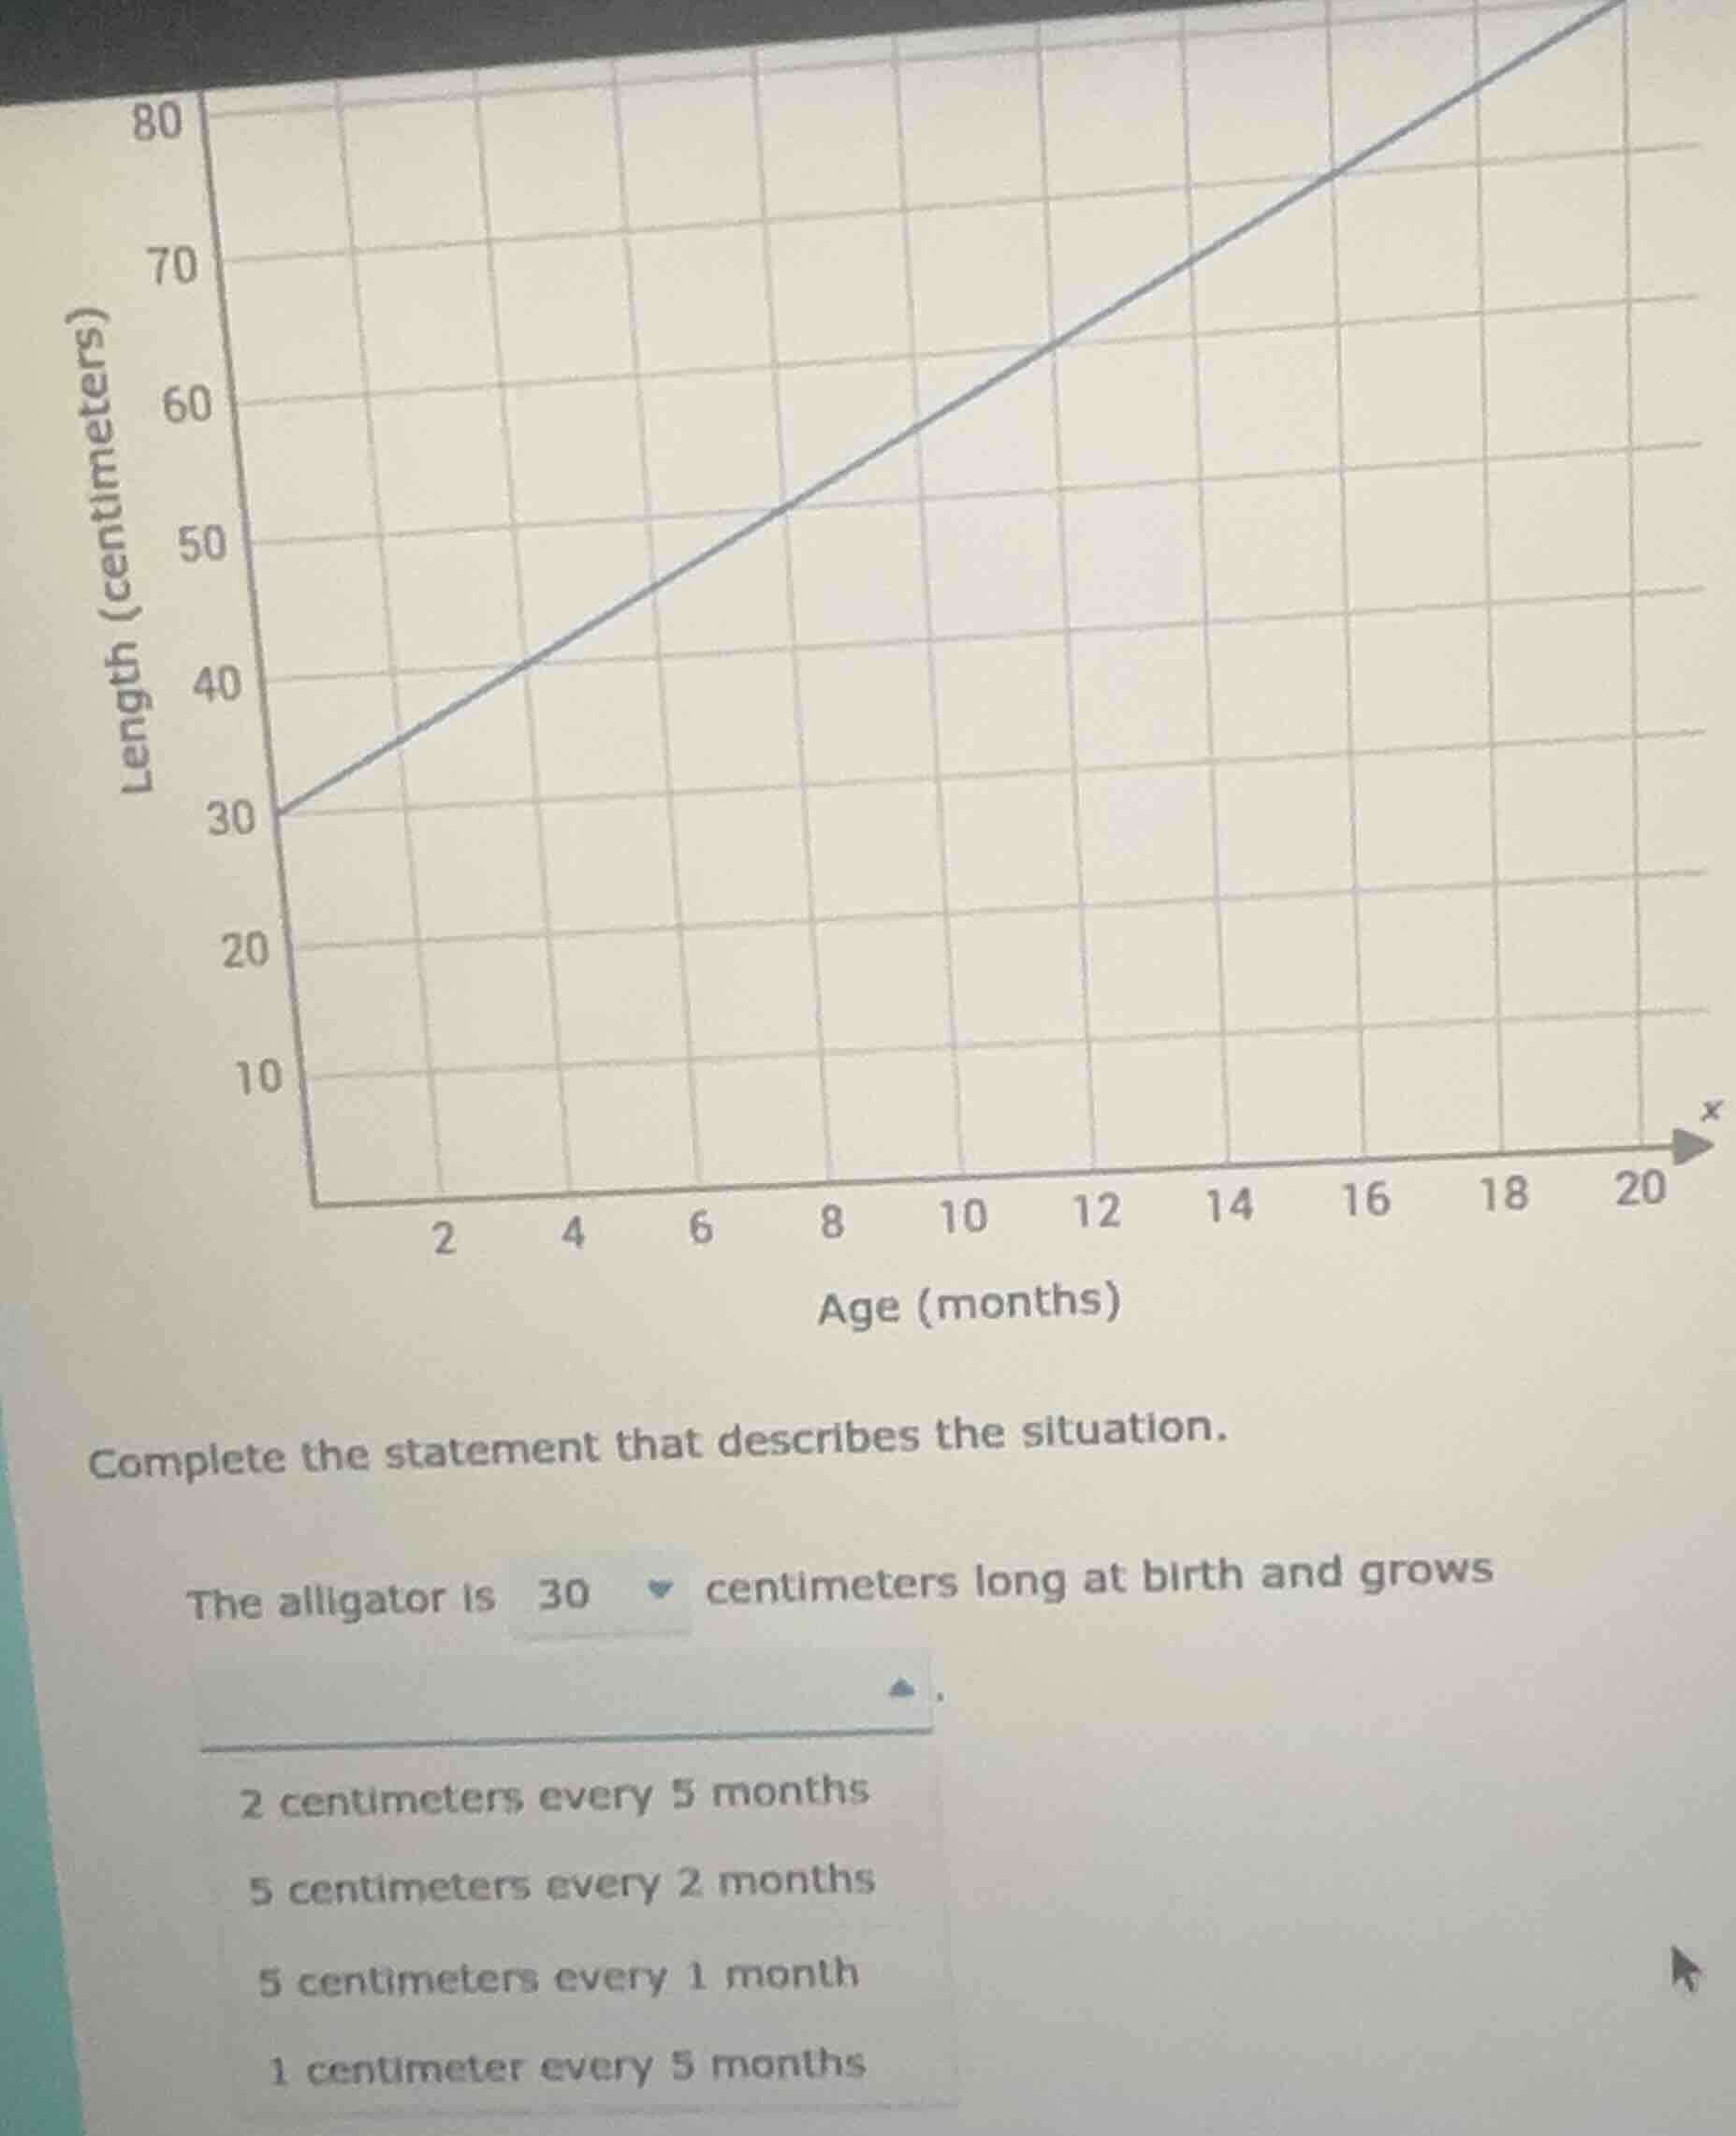
complete the statement that describes the situation. the alligator is 30 centimeters long at birth and grows ____. 2 centimeters every 5 months 5 centimeters every 2 months 5 centimeters every 1 month 1 centimeter every 5 months
Step1: Analyze the graph's slope (growth rate)
The graph starts at (0, 30) (birth, length 30 cm). Let's take another point, e.g., at \( x = 2 \) months, what's the length? Wait, better to calculate the rate. Let's use two points: (0, 30) and (2, 40)? Wait no, looking at the grid, at \( x = 0 \) (birth), \( y = 30 \). At \( x = 2 \) months, let's see the grid: each square is, say, 5 cm? Wait, no, let's check the options. The options are about growth per time. Let's calculate the slope (rate of change). The formula for slope is \( \frac{\Delta y}{\Delta x} \). Let's take two points: (0, 30) and (2, 40)? Wait no, maybe (0, 30) and (2, 40) is not right. Wait, looking at the graph, when \( x = 0 \), \( y = 30 \). When \( x = 2 \), let's see the y - axis: from 30 to 40? Wait, no, the first grid line after 30 is 40? Wait, the y - axis has 30, 40, 50, etc. So at \( x = 2 \) months, the length is 40? No, wait the line goes from (0,30) to, say, (2, 40)? Wait no, let's check the options. The options are 2 cm every 5 months, 5 cm every 2 months, 5 cm every 1 month, 1 cm every 5 months. Let's calculate the rate. Let's take \( x = 0 \) (length 30) and \( x = 2 \) (length 40? Wait no, maybe I misread. Wait, the graph: at x = 0, y = 30. At x = 2, let's see the grid. Each x - grid is 2 months? Wait, the x - axis is labeled 2,4,6,... So each grid square is 2 months? Wait, no, the x - axis has ticks at 0 (birth), 2,4,6,... So the distance between x = 0 and x = 2 is 2 months. The y - axis: at x = 0, y = 30; at x = 2, what's y? Let's see the line: from (0,30) to (2, 40)? Wait, no, the line goes up. Wait, let's calculate the slope. Let's take two points: (0, 30) and (2, 40) – no, that would be 10 cm in 2 months, which is 5 cm per month, but that's not an option. Wait, maybe (0,30) and (2, 40) is wrong. Wait, the options are 5 cm every 2 months. Let's check: 5 cm every 2 months means in 2 months, it grows 5 cm. So from 30, after 2 months, it's 35? No, that doesn't match. Wait, maybe I made a mistake. Wait, the correct way: let's take x = 0 (30 cm) and x = 2 (40 cm)? No, that's 10 cm in 2 months, which is 5 cm per month, but that's not an option. Wait, the options are:
Option 1: 2 cm every 5 months – slow.
Option 2: 5 cm every 2 months – let's see: in 2 months, 5 cm growth. So rate is \( \frac{5}{2}=2.5 \) cm per month.
Option 3: 5 cm every 1 month – 5 cm per month.
Option 4: 1 cm every 5 months – 0.2 cm per month.
Now, looking at the graph: from (0,30) to (2, 40)? No, that's 10 cm in 2 months (5 cm per month), but that's not an option. Wait, maybe the graph is (0,30) and (2, 40) is wrong. Wait, maybe the grid is different. Wait, the y - axis: 30, 40, 50,... So each y - grid is 10 cm? No, 30 to 40 is 10 cm. The x - axis: 0 to 2 is 2 months. So if at x = 2, y = 40, that's 10 cm in 2 months (5 cm per month), but that's not an option. Wait, the options have "5 centimeters every 2 months". Let's check: 5 cm every 2 months. So in 2 months, growth is 5 cm. So from 30, after 2 months, it's 35? But the graph seems to go to 40. Wait, maybe I misread the graph. Wait, the first point is (0,30), then at x = 2, the line is at 40? No, maybe the y - axis is 30, 35, 40? No, the labels are 30,40,50. So each major grid line is 10 cm. So between 30 and 40, there are two minor grids? No, the graph is a straight line. Wait, let's calculate the slope using the options. Let's take the option "5 centimeters every 2 months". So the rate is \( \frac{5}{2}=2.5 \) cm per month. Let's see the graph: from x = 0 to x = 2 (2 months), the change in y is 5 cm? No, the graph shows a…

Snap & solve any problem in the app
Get step-by-step solutions on Sovi AI
Photo-based solutions with guided steps
Explore more problems and detailed explanations
5 centimeters every 2 months