QUESTION IMAGE
Question
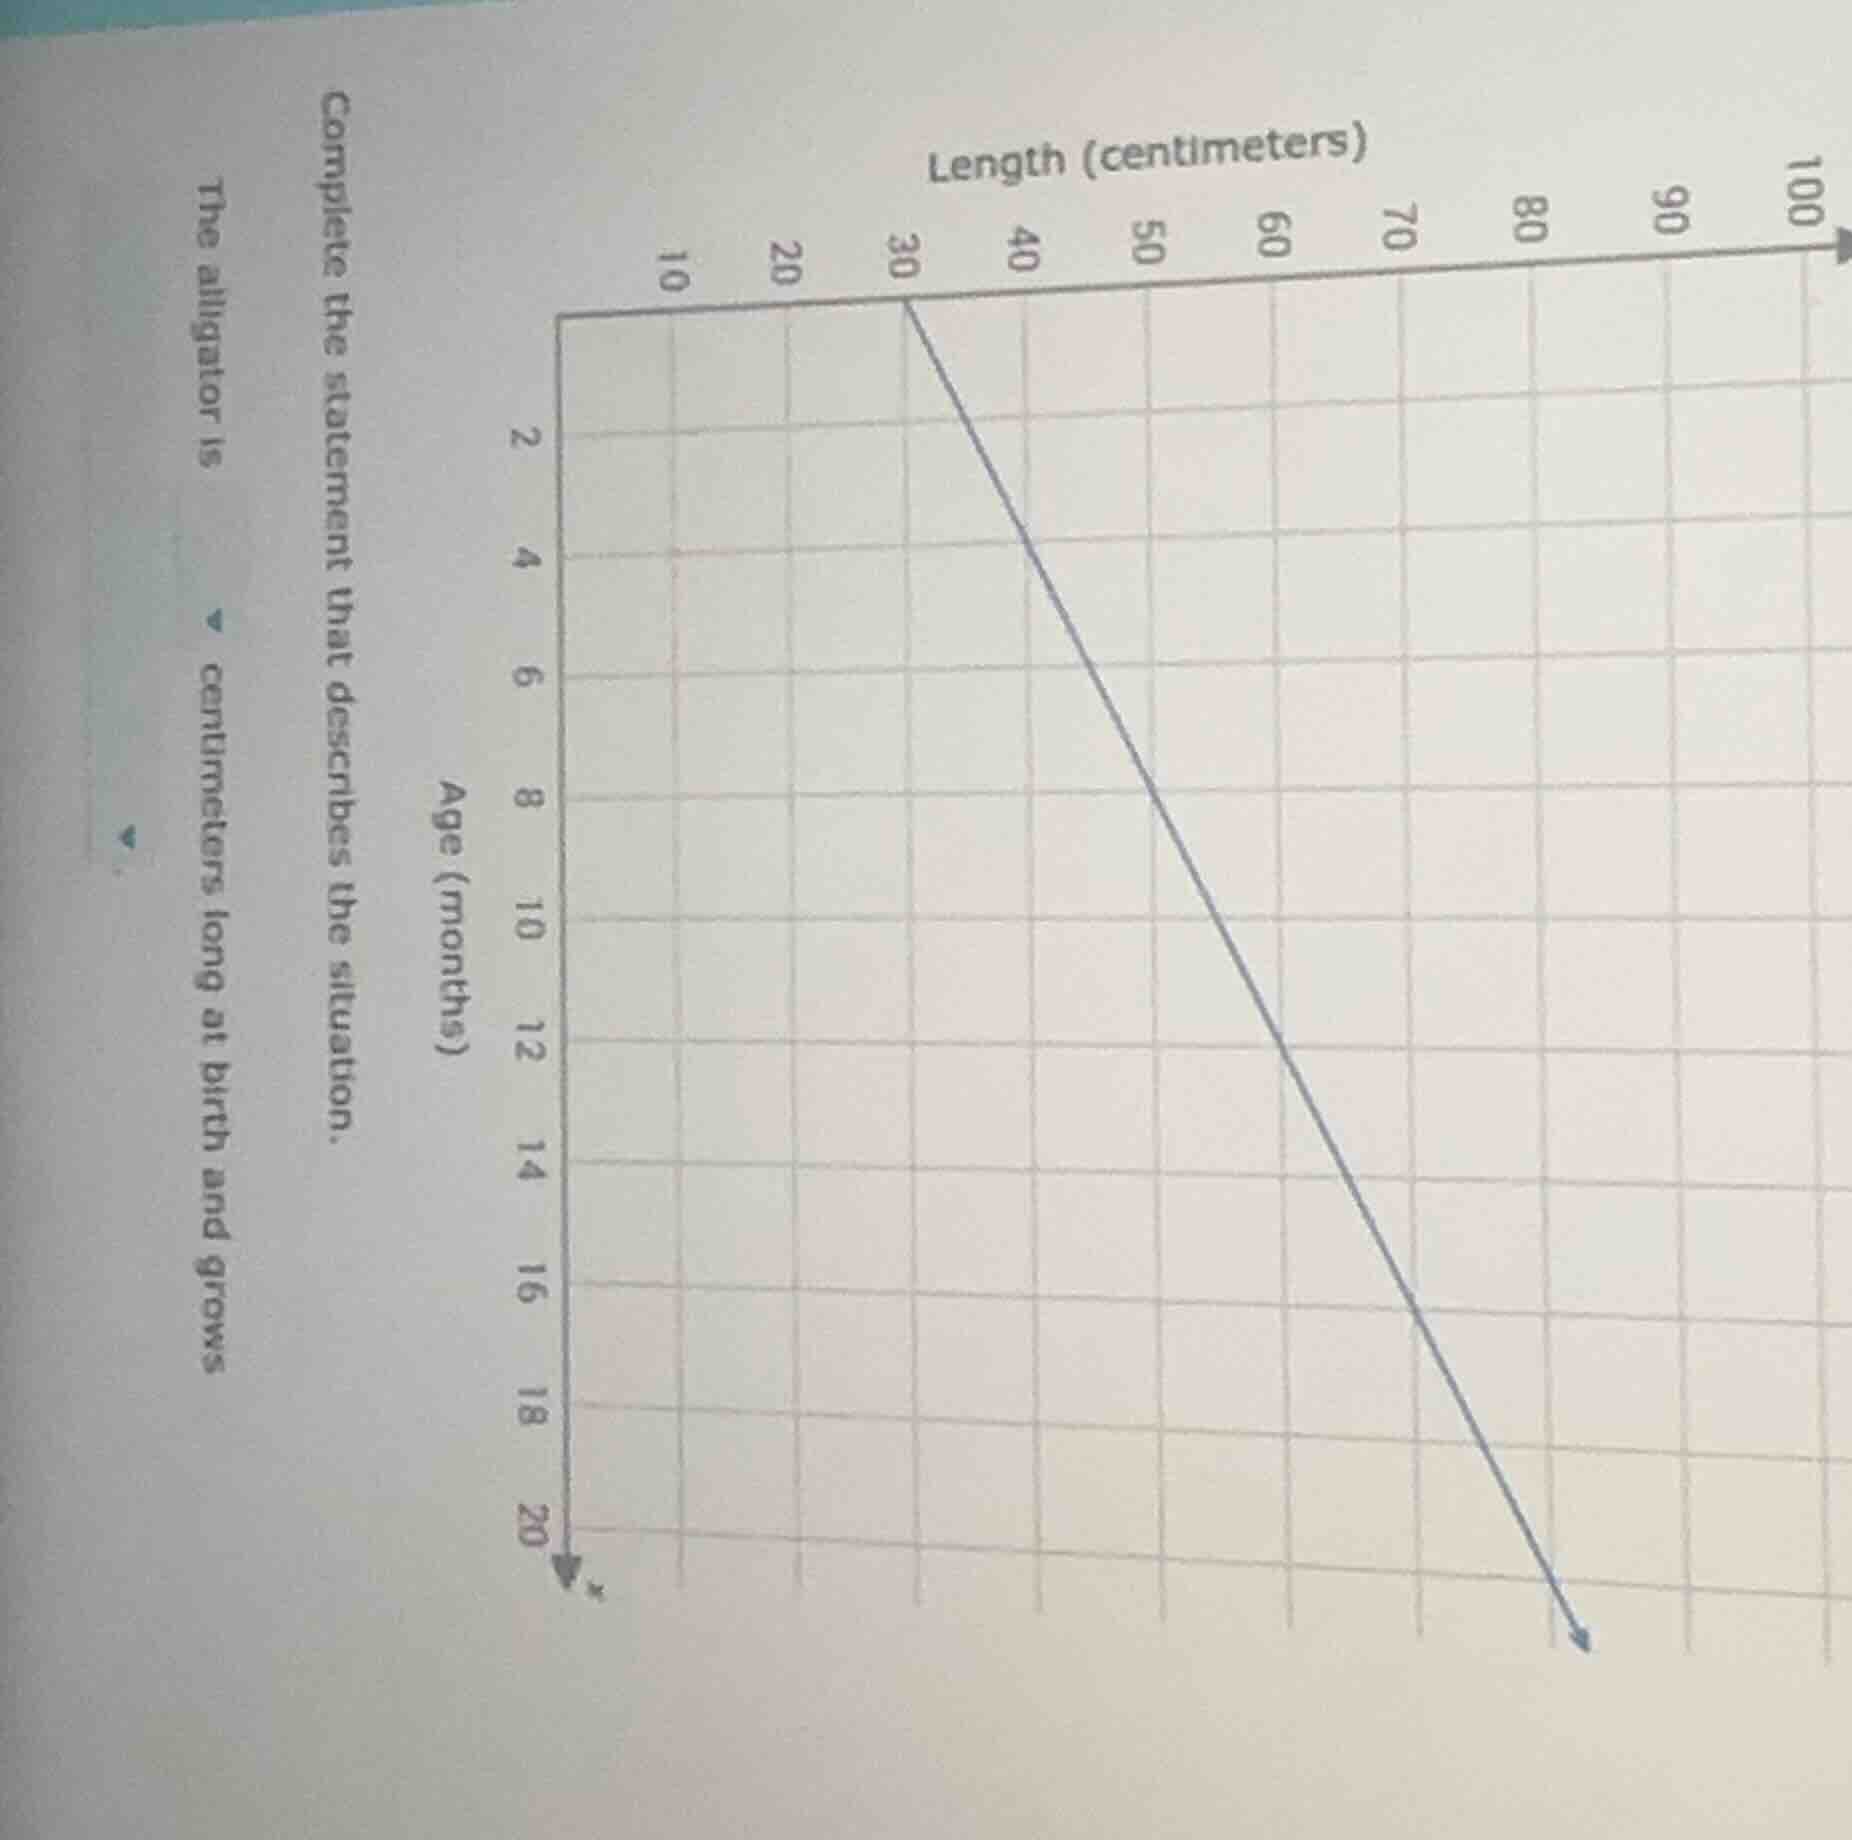
complete the statement that describes the situation.
the alligator is
centimeters long at birth and grows
Step1: Find length at birth (age=0)
At age 0 (birth), the x - intercept (when age=0, looking at the graph, the length is 30 cm? Wait, no, wait the axes: Wait, the x - axis is age (months) and y - axis? Wait no, the labels: Length (centimeters) is the horizontal axis (x - axis? Wait no, the graph: the vertical axis is Age (months) and horizontal is Length (centimeters)? Wait, no, the first label: "Length (centimeters)" is on the horizontal, "Age (months)" on the vertical. Wait, when age is 0 (birth), the length: looking at the line, when age (y - axis) is 0? Wait no, the line starts at (30, 0) on length - age? Wait, no, let's re - examine. Wait, the vertical axis is Age (months) from 0 to 20, horizontal is Length (cm) from 10 to 100. The line goes from (30, 0) [length=30, age=0]? Wait, no, when age is 0 (birth), the length is 30 cm? Wait, then to find the growth rate, we can take two points. Let's take (30, 0) and (let's say when age is 12 months, what's the length? Wait, the line: when age is 12 months, length is 60? Wait, no, let's calculate the slope. Wait, the problem is: "The alligator is [ ] centimeters long at birth and grows [ ] centimeters per month."
Wait, birth is age=0. From the graph, when age (y - axis) is 0, the length (x - axis) is 30 cm? Wait, no, maybe I got the axes reversed. Wait, maybe the horizontal axis is age and vertical is length? No, the labels: "Length (centimeters)" is horizontal, "Age (months)" is vertical. Wait, the line: when age (vertical) is 0, length (horizontal) is 30. Then, when age is 12 months, length is 60? Wait, no, let's check the slope. The slope (growth rate) is (change in length)/(change in age). Let's take two points: (30, 0) [length=30, age=0] and (let's say when age=12, length=60? Wait, no, the line: from (30, 0) to (let's see, when age is 12, the x - coordinate (length) is 60? Wait, the difference in age: 12 - 0 = 12 months. Difference in length: 60 - 30 = 30 cm. So growth rate is 30/12 = 2.5? Wait, no, maybe the first point is (30, 0) (length=30, age=0) and another point: when age=12, length=60? Wait, 60 - 30 = 30 over 12 months, so 30/12 = 2.5? Wait, no, maybe I messed up the axes. Wait, maybe the vertical axis is length and horizontal is age? No, the labels say otherwise. Wait, the problem says "at birth" (age=0) and "grows [ ] per month". Let's look at the graph again. The line starts at (30, 0) (length=30, age=0) and goes to, say, (when age=12, length=60). So the change in length is 60 - 30 = 30, change in age is 12 - 0 = 12. So 30/12 = 2.5? Wait, no, maybe the first point is (0, 30) if axes are reversed. Wait, maybe the horizontal axis is age (months) and vertical is length (cm). Let's assume that: horizontal (x) is age, vertical (y) is length. Then the line would have x=0 (birth) at y=30? No, the graph's labels are confusing. Wait, the correct way: at birth, age=0. From the graph, when age=0, the length is 30 cm. Then, to find the growth rate, we can see that for each month, how much does length increase. Let's take two points: (0, 30) and (12, 60). Then the growth rate is (60 - 30)/(12 - 0)=30/12 = 2.5? Wait, no, maybe the first point is (30, 0) (length=30, age=0) and (60, 12) (length=60, age=12). Then slope is (60 - 30)/(12 - 0)=30/12 = 2.5. Wait, but maybe the graph is such that at birth (age=0), length is 30 cm, and the growth rate is 5 cm per month? Wait, no, let's check again. Wait, the problem is likely that at birth (age=0), length is 30 cm, and the slope (growth rate) is (change in length)/(change in age). Let's take age=0 (length=30) and age=12 (length=90? No, the g…

Snap & solve any problem in the app
Get step-by-step solutions on Sovi AI
Photo-based solutions with guided steps
Explore more problems and detailed explanations
The alligator is 30 centimeters long at birth and grows 3 centimeters per month.