QUESTION IMAGE
Question
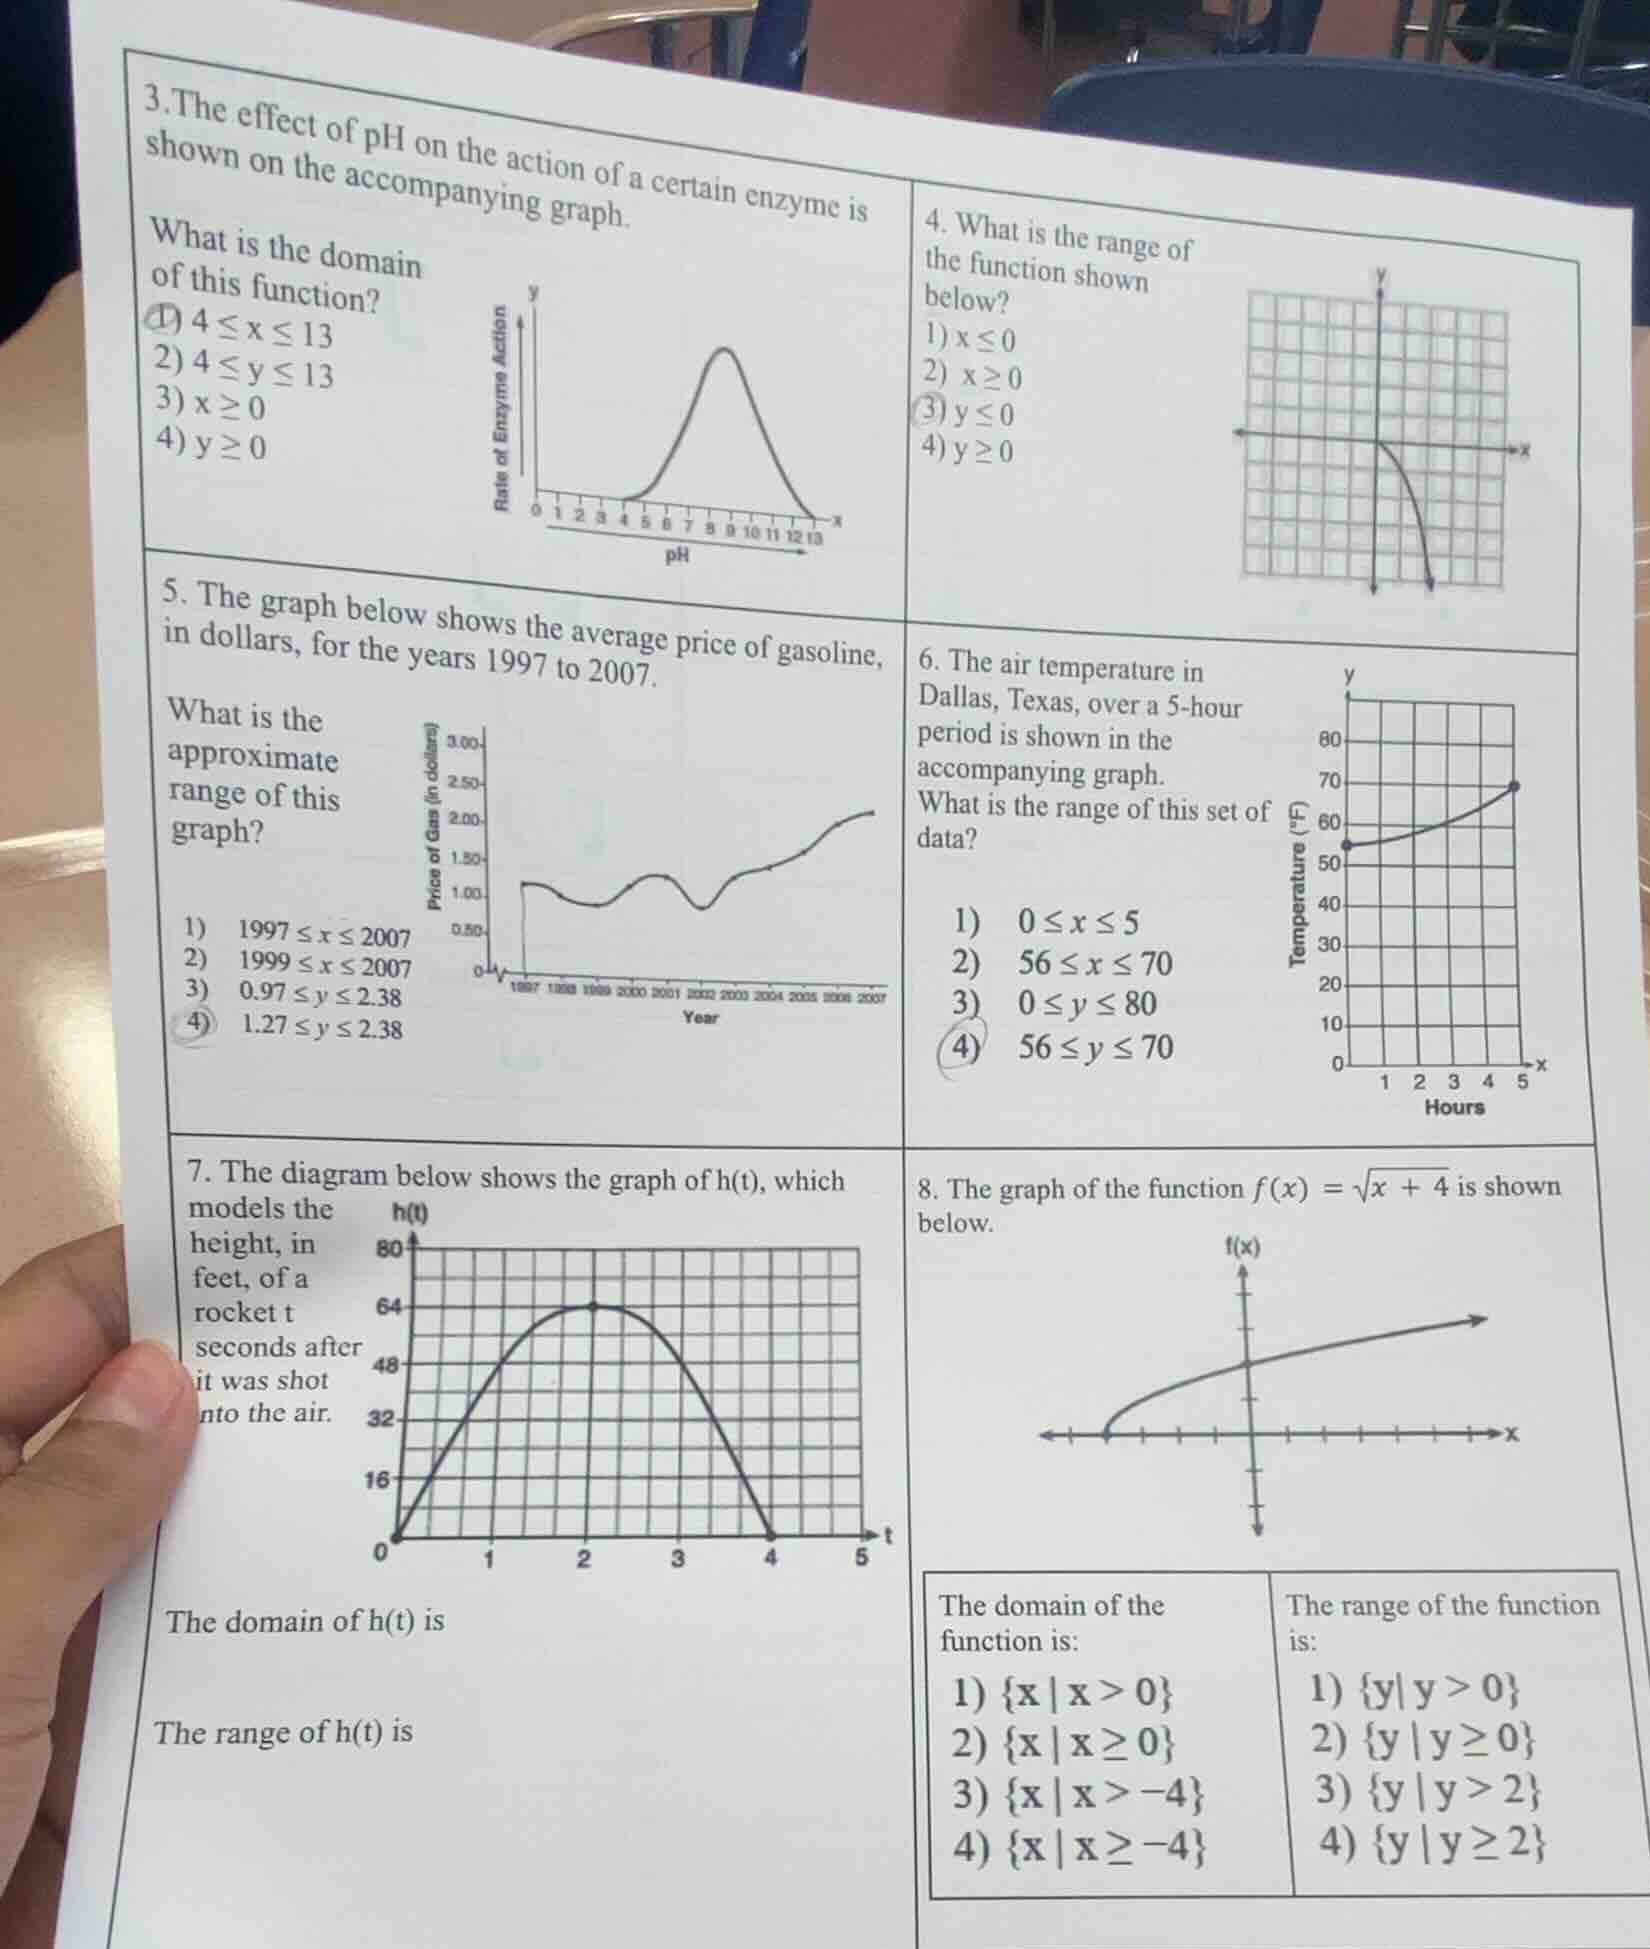
- the effect of ph on the action of a certain enzyme is shown on the accompanying graph.
what is the domain of this function?
①) 4 ≤ x ≤ 13
- 4 ≤ y ≤ 13
- x ≥ 0
- y ≥ 0
- what is the range of the function shown below?
- x ≤ 0
- x ≥ 0
- y ≤ 0
- y ≥ 0
- the graph below shows the average price of gasoline, in dollars, for the years 1997 to 2007.
what is the approximate range of this graph?
- 1997 ≤ x ≤ 2007
- 1999 ≤ x ≤ 2007
- 0.97 ≤ y ≤ 2.38
- 1.27 ≤ y ≤ 2.38
- the air temperature in dallas, texas, over a 5 - hour period is shown in the accompanying graph.
what is the range of this set of data?
- 0 ≤ x ≤ 5
- 56 ≤ x ≤ 70
- 0 ≤ y ≤ 80
- 56 ≤ y ≤ 70
- the diagram below shows the graph of h(t), which models the height, in feet, of a rocket t seconds after it was shot into the air.
the domain of h(t) is
the range of h(t) is
- the graph of the function f(x) = √(x + 4) is shown below.
the domain of the function is:
- {x | x > 0}
- {x | x ≥ 0}
- {x | x > - 4}
- {x | x ≥ - 4}
the range of the function is:
- {y | y > 0}
- {y | y ≥ 0}
- {y | y > 2}
- {y | y ≥ 2}
Question 3
Step1: Recall domain definition
Domain is the set of all x - values (input values) for a function. For the enzyme - pH graph, the x - axis represents pH.
From the graph, the pH (x - values) starts at 4 and goes up to 13. So the domain is the set of x - values where \(4\leq x\leq13\).
Step1: Recall range definition
Range is the set of all y - values (output values) for a function. Looking at the graph, the y - values of the function are all less than or equal to 0 (since the graph is below or on the x - axis). So the range is \(y\leq0\).
Step1: Recall range definition for a real - world graph
The range of a graph representing the price of gasoline (y - axis is price in dollars) is the set of all possible y - values (prices). From the graph, we can see that the minimum price (y - value) is approximately 1.27 and the maximum is approximately 2.38. So the range is \(1.27\leq y\leq2.38\).

Snap & solve any problem in the app
Get step-by-step solutions on Sovi AI
Photo-based solutions with guided steps
Explore more problems and detailed explanations
- \(4\leq x\leq13\)