QUESTION IMAGE
Question
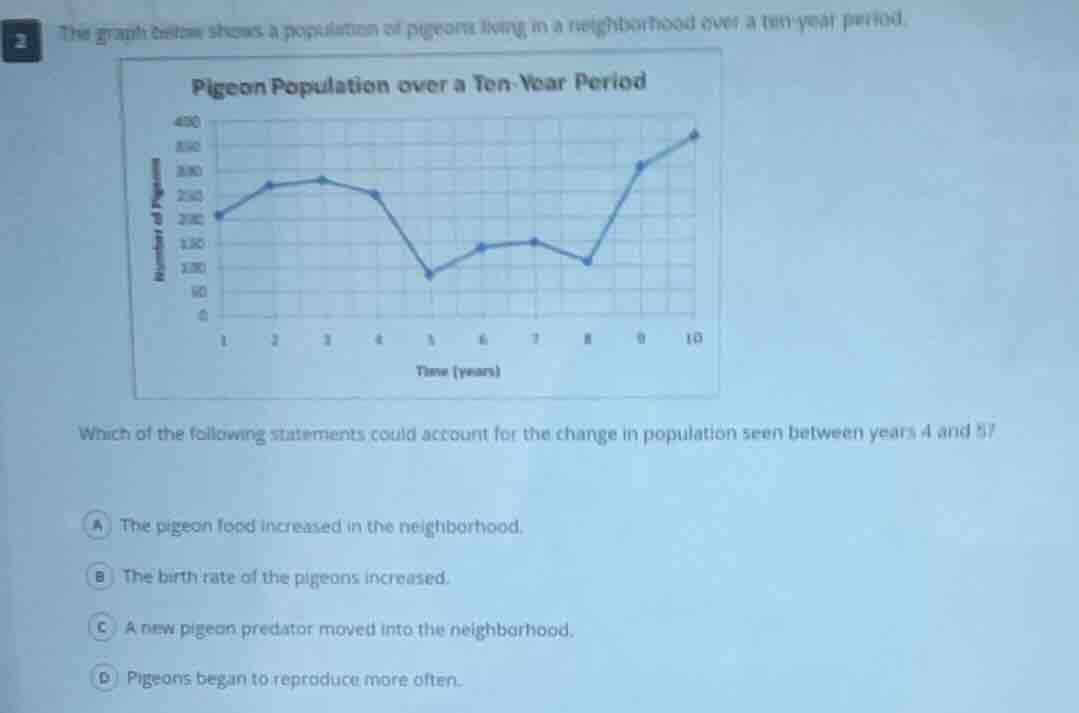
the graph below shows a population of pigeons living in a neighborhood over a ten - year period.
pigeon population over a ten - year period
which of the following statements could account for the change in population seen between years 4 and 5?
a the pigeon food increased in the neighborhood.
b the birth rate of the pigeons increased.
c a new pigeon predator moved into the neighborhood.
d pigeons began to reproduce more often.
Between years 4 and 5, the pigeon population drops sharply. A new predator would increase pigeon mortality, causing a population decline. The other options (more food, higher birth rate, more reproduction) would lead to population growth, not a decrease.

Snap & solve any problem in the app
Get step-by-step solutions on Sovi AI
Photo-based solutions with guided steps
Explore more problems and detailed explanations
C. A new pigeon predator moved into the neighborhood.