QUESTION IMAGE
Question
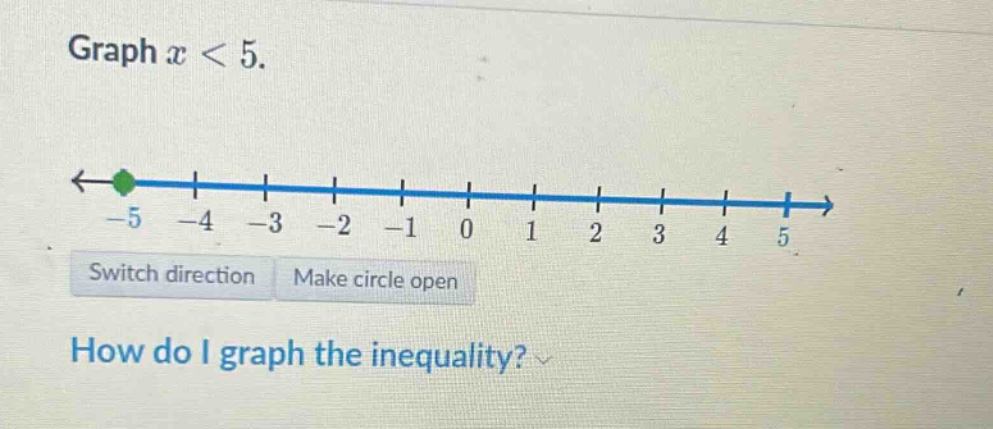
graph $x < 5$.
how do i graph the inequality?
Step1: Analyze the inequality symbol
The inequality is \( x < 5 \). The "less than" symbol (\(<\)) means that \( x \) can take any value strictly less than 5, so 5 is not included in the solution set. For a number line graph, we use an open circle at the boundary value (5) to indicate that the value is not included.
Step2: Determine the direction of the line
Since \( x \) is less than 5, the solutions are all the numbers to the left of 5 on the number line. So we draw a line extending to the left from the open circle at 5.
Step3: Correct the initial graph (if needed)
In the given initial graph, there is a green dot at -5 (which is not relevant for \( x < 5 \)) and the circle at 5 is not open (it seems to be a closed dot or a different mark). So we need to:
- Remove the green dot at -5 (or ignore it as it's not part of the correct graph for \( x < 5 \)).
- Make the circle at 5 open (to show 5 is not included).
- Draw the line from the open circle at 5 towards the left (since \( x < 5 \) means values less than 5, which are to the left on the number line).

Snap & solve any problem in the app
Get step-by-step solutions on Sovi AI
Photo-based solutions with guided steps
Explore more problems and detailed explanations
To graph \( x < 5 \):
- Place an open circle at \( 5 \) on the number line (since \( 5 \) is not a solution, as \( x < 5 \) means \( x \) cannot equal \( 5 \)).
- Draw a line (or an arrow) extending to the left from the open circle at \( 5 \) (since all numbers less than \( 5 \) lie to the left of \( 5 \) on the number line).
In the provided graph, you should:
- Click "Make circle open" to change the circle at \( 5 \) to an open circle (removing the closed dot appearance).
- Ensure the line/arrow points to the left (toward values less than \( 5 \)), not involving the -5 dot (which is irrelevant here).