QUESTION IMAGE
Question
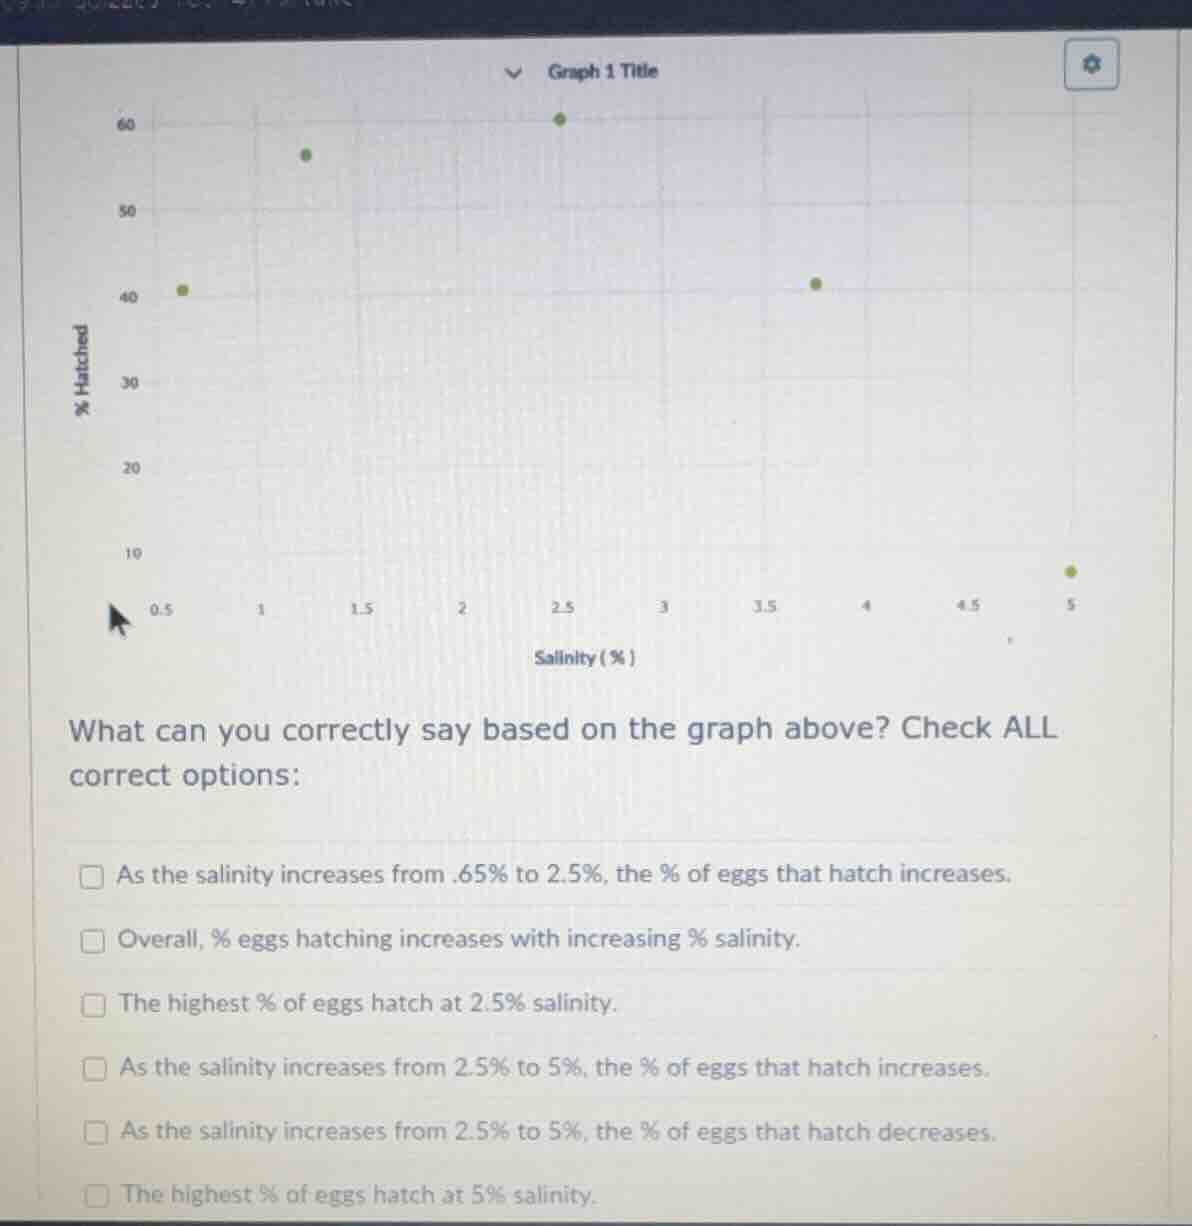
graph 1 title
% hatched
salinity ( % )
what can you correctly say based on the graph above? check all correct options:
as the salinity increases from.65% to 2.5%, the % of eggs that hatch increases.
overall, % eggs hatching increases with increasing % salinity.
the highest % of eggs hatch at 2.5% salinity.
as the salinity increases from 2.5% to 5%, the % of eggs that hatch increases.
as the salinity increases from 2.5% to 5%, the % of eggs that hatch decreases.
the highest % of eggs hatch at 5% salinity.
Brief Explanations
- For salinity 0.65% (≈40% hatched) to 2.5% (60% hatched), the hatching percentage rises.
- Overall, hatching % rises then falls with salinity, so the overall increase claim is false.
- The highest hatching value (60%) is at 2.5% salinity.
- From 2.5% (60%) to 5% (≈7% hatched), hatching percentage drops, so the increase claim is false.
- From 2.5% to 5%, the hatching percentage clearly decreases.
- The lowest hatching value is at 5% salinity, so this claim is false.

Snap & solve any problem in the app
Get step-by-step solutions on Sovi AI
Photo-based solutions with guided steps
Explore more problems and detailed explanations
- As the salinity increases from.65% to 2.5%, the % of eggs that hatch increases.
- The highest % of eggs hatch at 2.5% salinity.
- As the salinity increases from 2.5% to 5%, the % of eggs that hatch decreases.