QUESTION IMAGE
Question
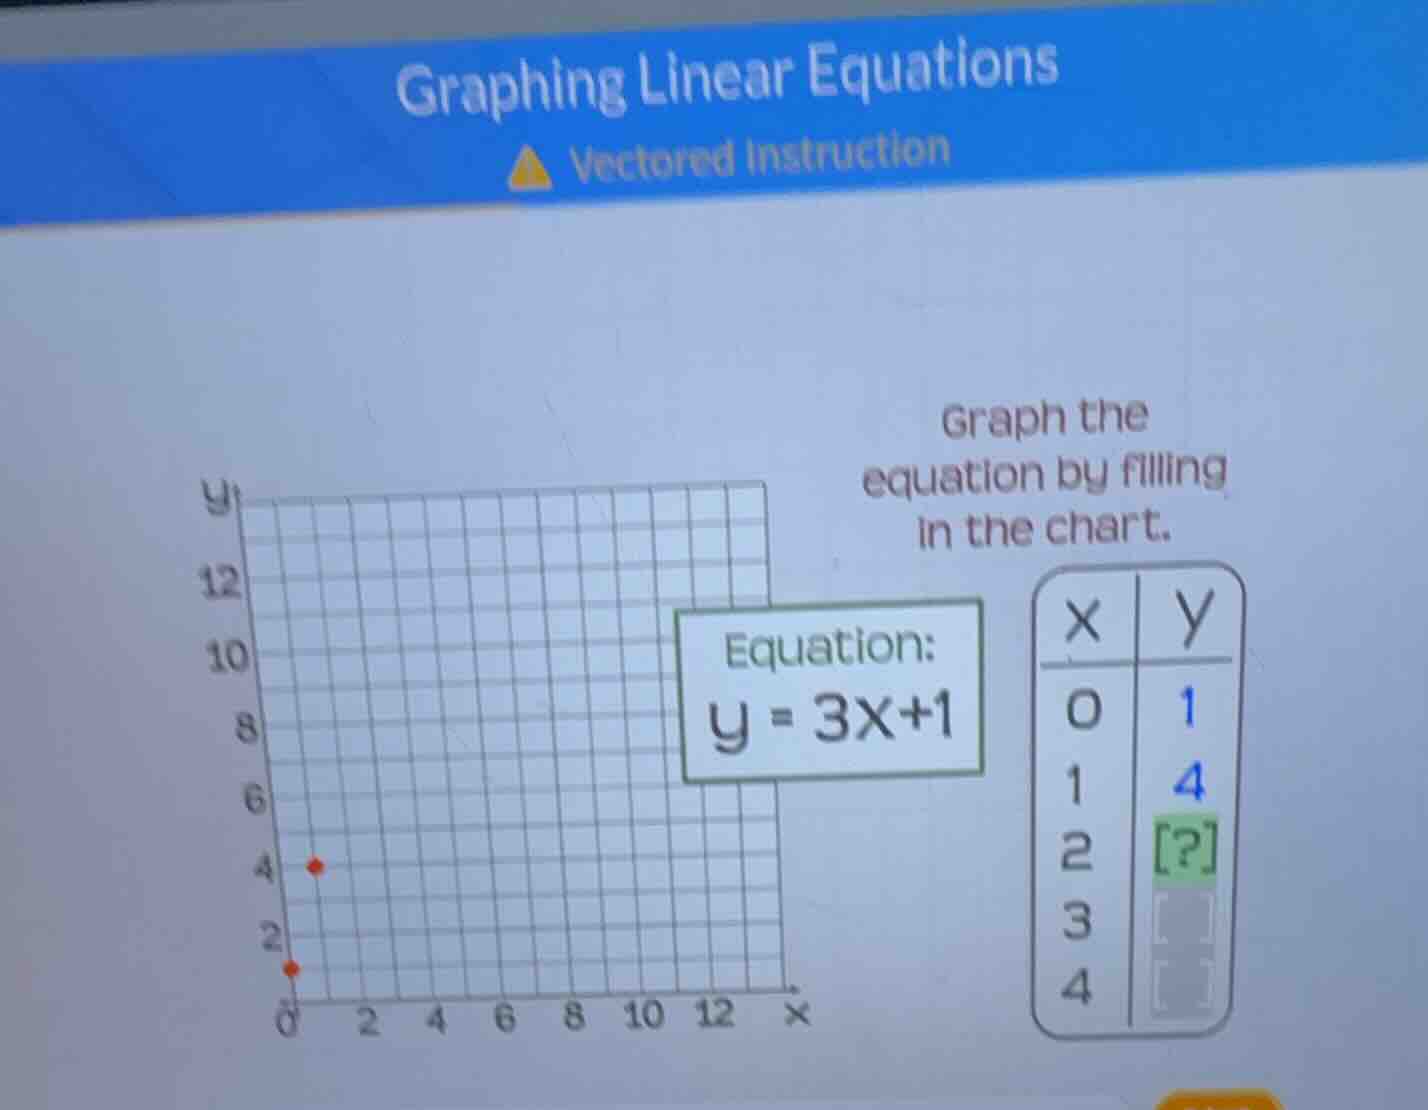
graphing linear equations vectored instruction graph the equation by filling in the chart. equation: y = 3x+1
Step1: Substitute x = 2 into the equation
We have the equation \( y = 3x + 1 \). Substitute \( x = 2 \) into it.
\( y = 3\times2 + 1 \)
Step2: Calculate the value of y
First, calculate \( 3\times2 = 6 \), then add 1: \( 6 + 1 = 7 \).
\( y = 7 \)
Step3: Substitute x = 3 into the equation
Substitute \( x = 3 \) into \( y = 3x + 1 \).
\( y = 3\times3 + 1 \)
Step4: Calculate the value of y for x = 3
Calculate \( 3\times3 = 9 \), then add 1: \( 9 + 1 = 10 \).
\( y = 10 \)
Step5: Substitute x = 4 into the equation
Substitute \( x = 4 \) into \( y = 3x + 1 \).
\( y = 3\times4 + 1 \)
Step6: Calculate the value of y for x = 4
Calculate \( 3\times4 = 12 \), then add 1: \( 12 + 1 = 13 \).
\( y = 13 \)

Snap & solve any problem in the app
Get step-by-step solutions on Sovi AI
Photo-based solutions with guided steps
Explore more problems and detailed explanations
For \( x = 2 \), \( y = 7 \); for \( x = 3 \), \( y = 10 \); for \( x = 4 \), \( y = 13 \)
So the completed table is:
| X | Y |
|---|---|
| 1 | 4 |
| 2 | 7 |
| 3 | 10 |
| 4 | 13 |