QUESTION IMAGE
Question
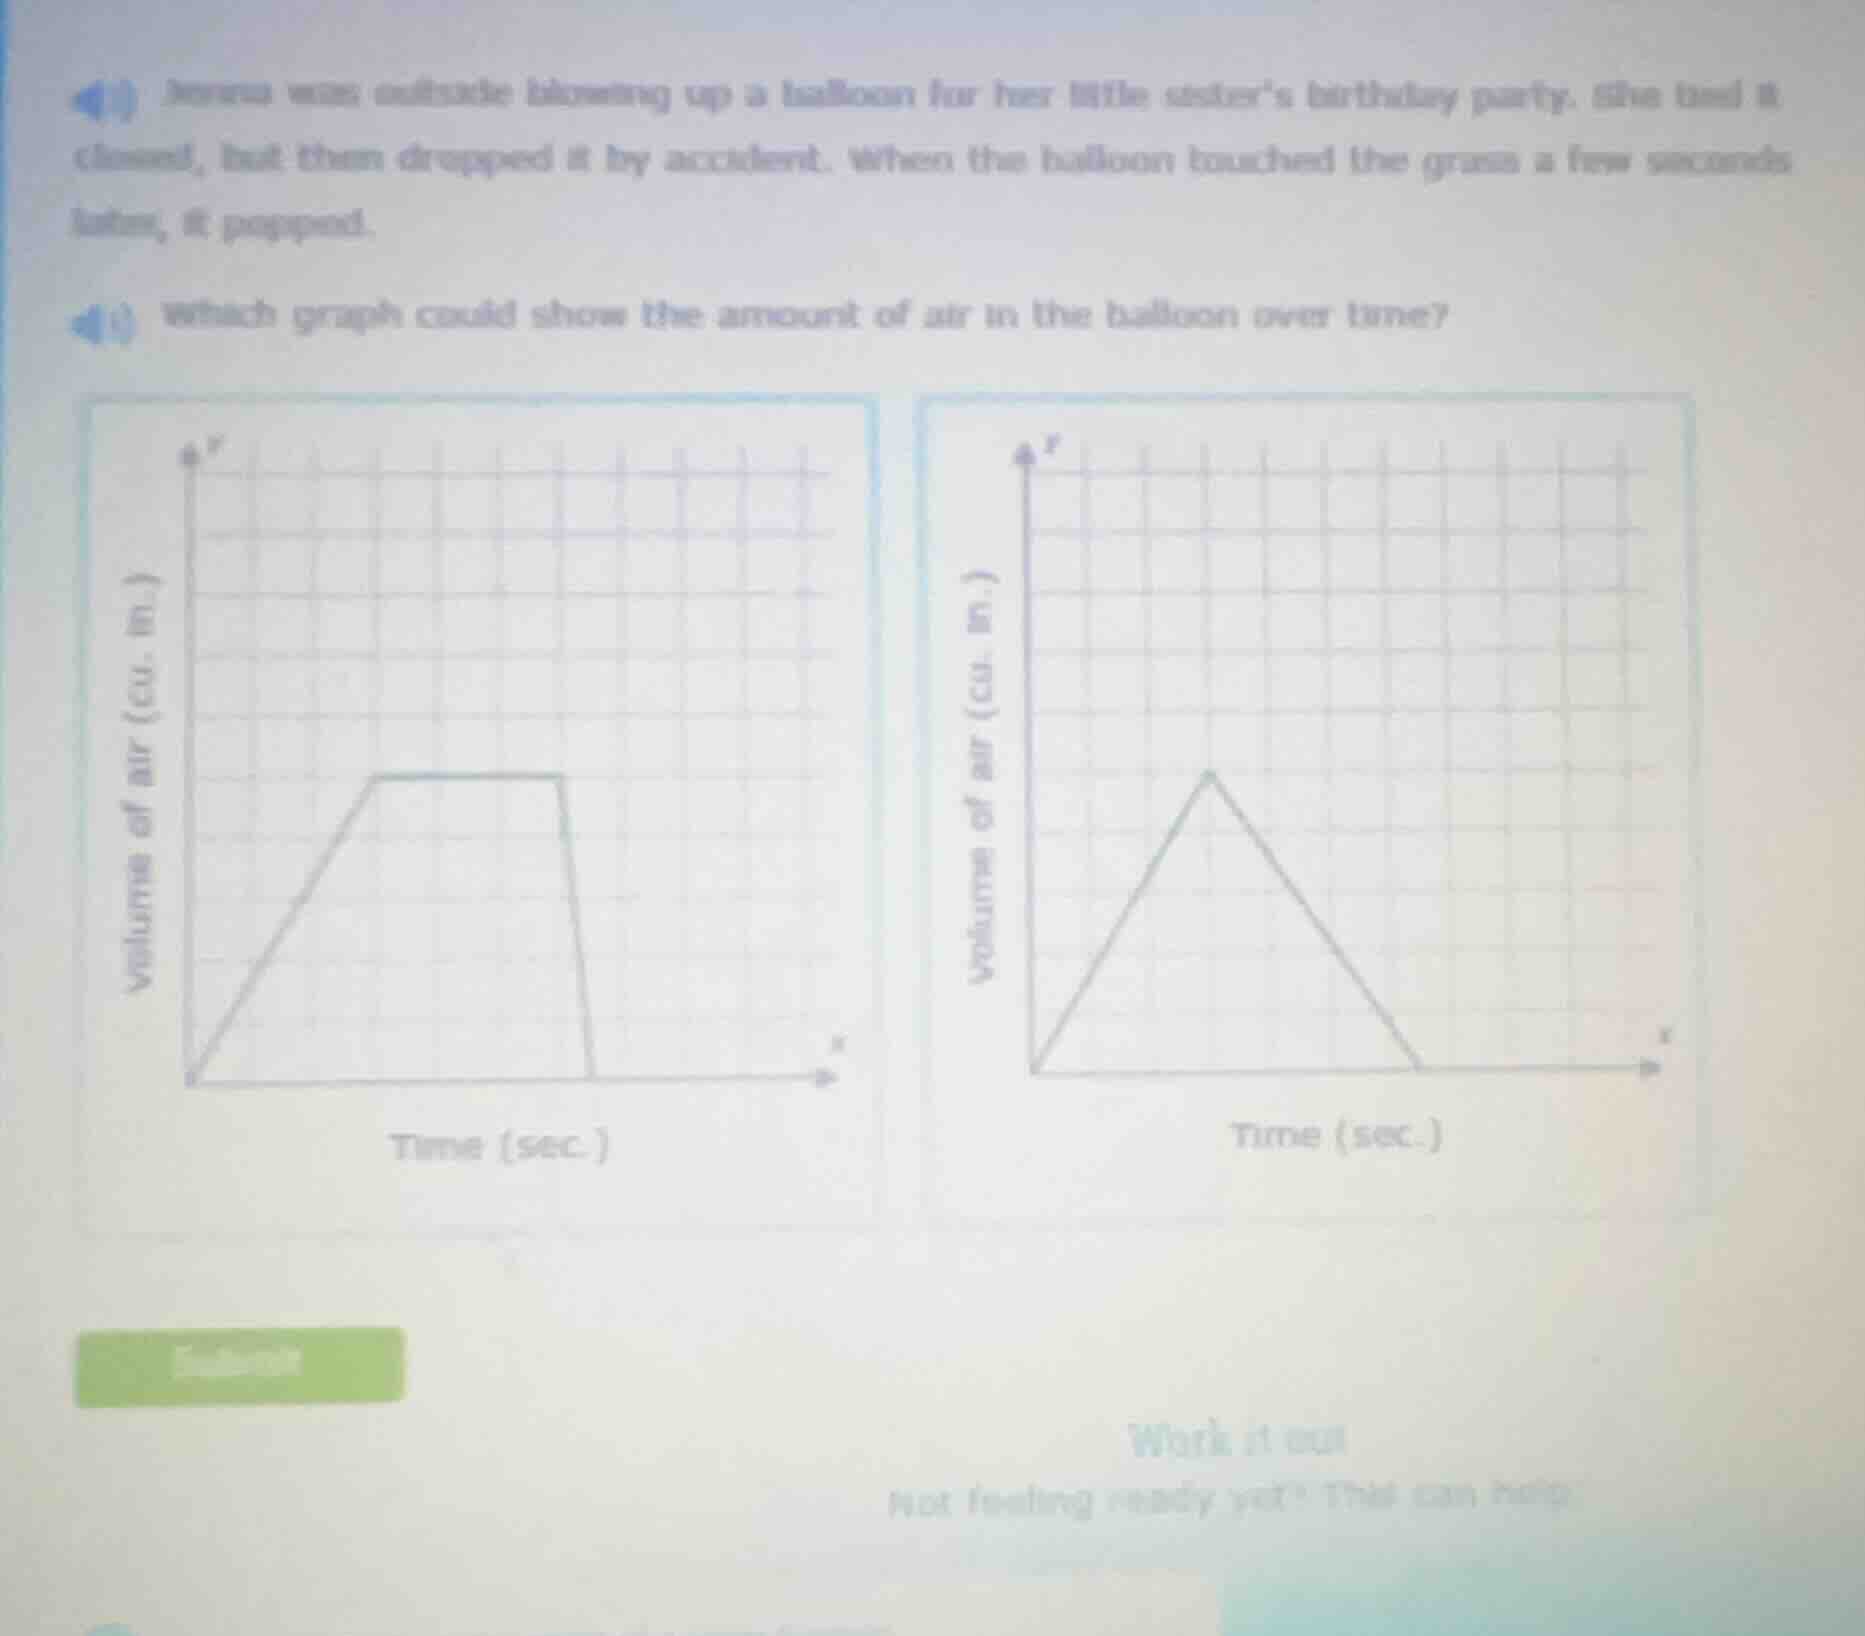
jorena was outside blowing up a balloon for her little sisters birthday party. she tied it closed, but then dropped it by accident. when the balloon touched the grass a few seconds later, it popped. which graph could show the amount of air in the balloon over time?
Brief Explanations
- First, Jessica blows up the balloon: the volume of air increases steadily over time.
- Then she ties it closed and holds it: the volume of air stays constant for a period.
- Finally, the balloon drops and pops: the volume of air drops instantly to zero.
The first graph matches this sequence, while the second graph shows the volume decreasing gradually instead of staying constant then dropping instantly.

Snap & solve any problem in the app
Get step-by-step solutions on Sovi AI
Photo-based solutions with guided steps
Explore more problems and detailed explanations
The left graph (with increasing, flat, then vertical drop segments)