QUESTION IMAGE
Question
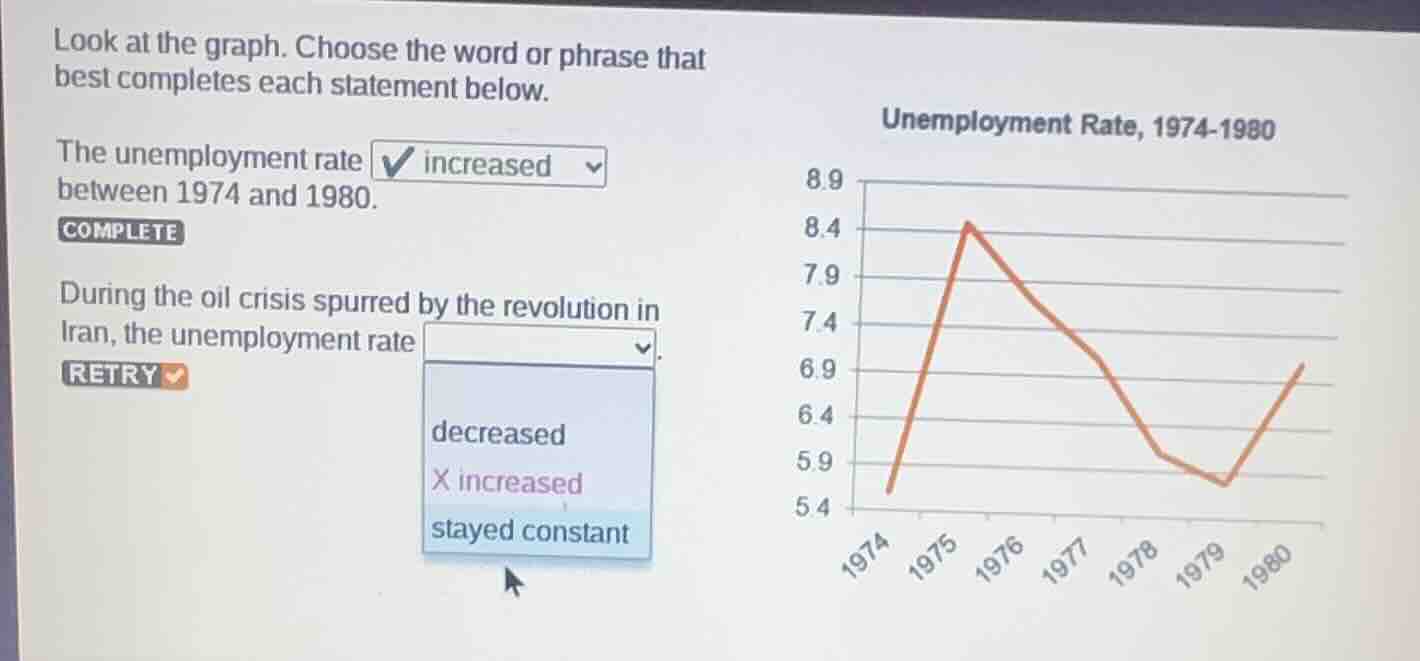
look at the graph. choose the word or phrase that best completes each statement below. the unemployment rate increased between 1974 and 1980. during the oil crisis spurred by the revolution in iran, the unemployment rate. options: decreased, increased, stayed constant. (graph: unemployment rate, 1974 - 1980 with years 1974 - 1980 on x - axis and rates 5.4 - 8.9 on y - axis, showing a line graph of unemployment rate over these years)
The Iranian Revolution and associated oil crisis occurred around 1979. Looking at the graph, the unemployment rate rises from its 1979 low to a higher value in 1980, meaning it increased during this period.

Snap & solve any problem in the app
Get step-by-step solutions on Sovi AI
Photo-based solutions with guided steps
Explore more problems and detailed explanations
increased