QUESTION IMAGE
Question
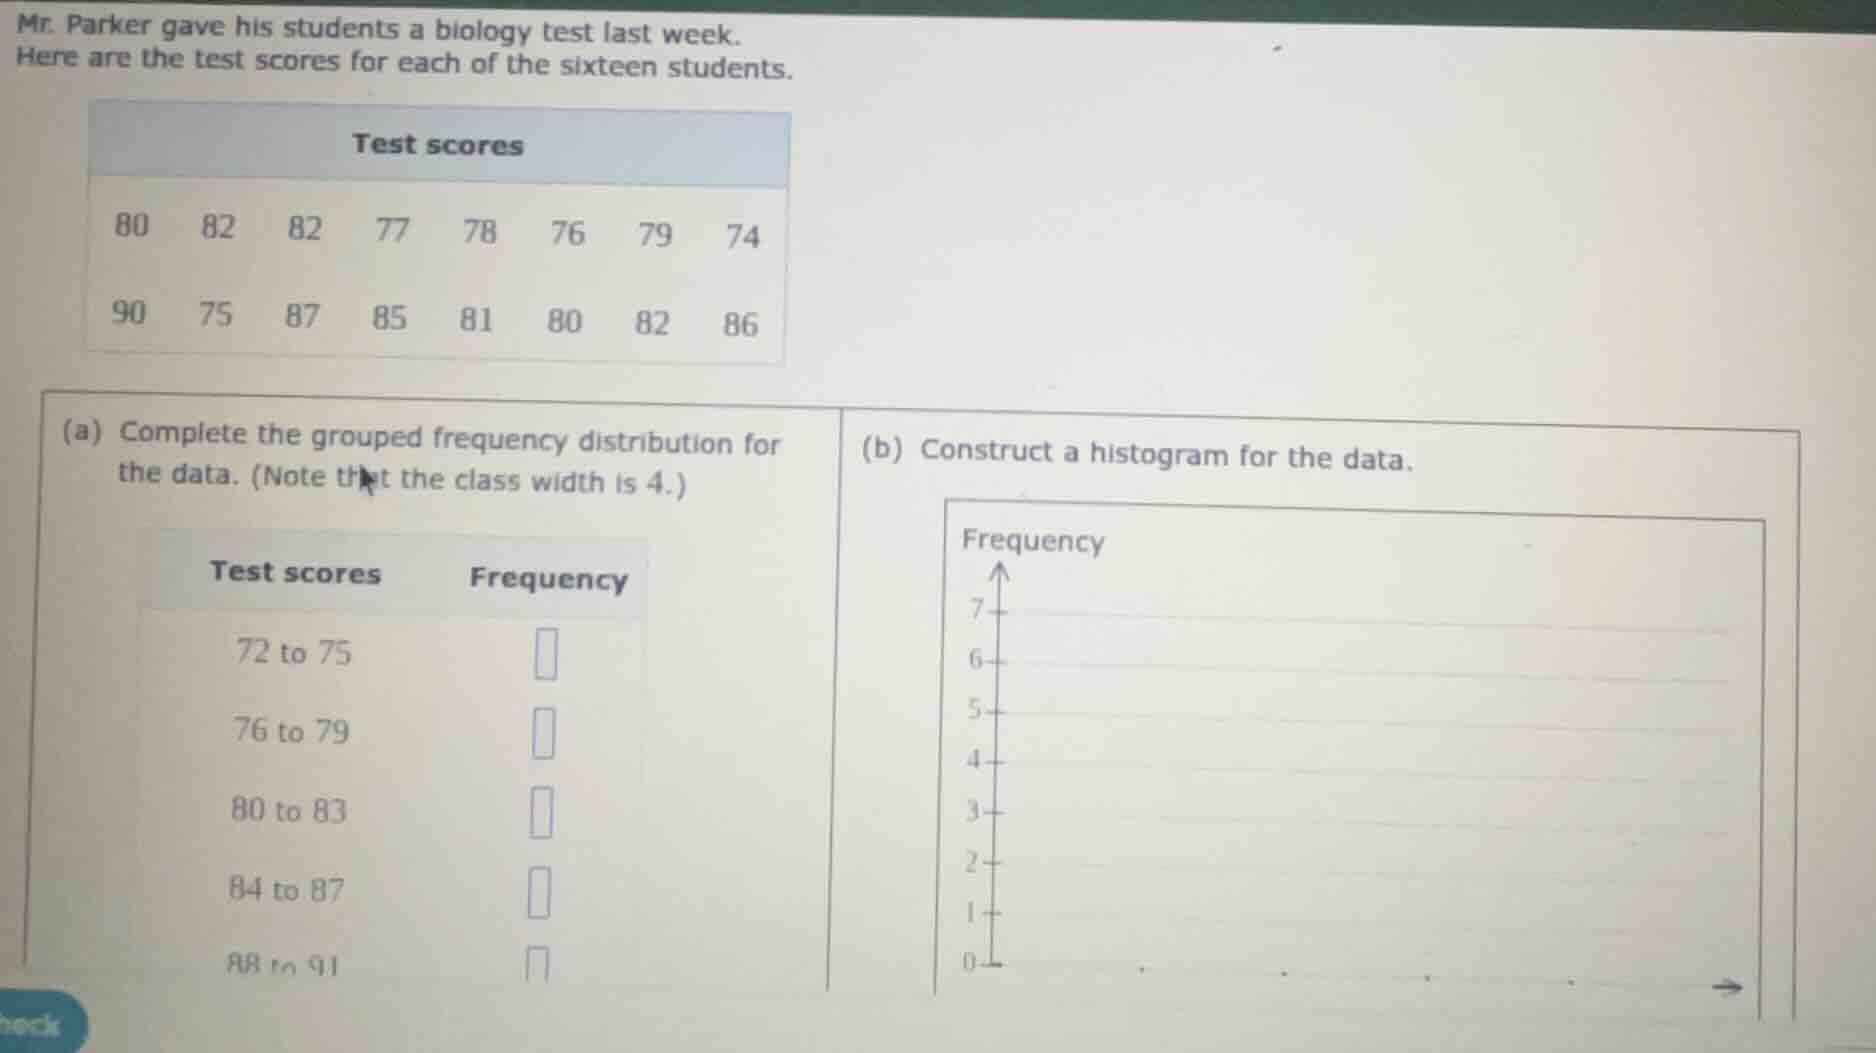
mr. parker gave his students a biology test last week. here are the test scores for each of the sixteen students. test scores 80 82 82 77 78 76 79 74 90 75 87 85 81 80 82 86 (a) complete the grouped frequency distribution for the data. (note that the class width is 4.) test scores frequency 72 to 75 76 to 79 80 to 83 84 to 87 88 to 91 (b) construct a histogram for the data. frequency 7 6 5 4 3 2 1 0
Step1: List all test scores
Scores: 74, 75, 76, 77, 78, 79, 80, 80, 81, 82, 82, 82, 85, 86, 87, 90
Step2: Count 72-75 scores
Scores in range: 74, 75 → Frequency = 2
Step3: Count 76-79 scores
Scores in range: 76, 77, 78, 79 → Frequency = 4
Step4: Count 80-83 scores
Scores in range: 80, 80, 81, 82, 82, 82 → Frequency = 6
Step5: Count 84-87 scores
Scores in range: 85, 86, 87 → Frequency = 3
Step6: Count 88-91 scores
Scores in range: 90 → Frequency = 1
Step7: Prepare histogram axes
X-axis: Test score groups (72-75, 76-79, 80-83, 84-87, 88-91)
Y-axis: Frequency (0 to 7)
Step8: Draw histogram bars
Bar heights match frequencies: 2, 4, 6, 3, 1 respectively

Snap & solve any problem in the app
Get step-by-step solutions on Sovi AI
Photo-based solutions with guided steps
Explore more problems and detailed explanations
(a) Completed Grouped Frequency Distribution
| Test scores | Frequency |
|---|---|
| 76 to 79 | 4 |
| 80 to 83 | 6 |
| 84 to 87 | 3 |
| 88 to 91 | 1 |
(b) Histogram Description
- X-axis labeled with test score intervals: 72-75, 76-79, 80-83, 84-87, 88-91
- Y-axis labeled with Frequency (0 to 7)
- Bars (equal width) with heights corresponding to frequencies:
- 72-75: height = 2
- 76-79: height = 4
- 80-83: height = 6
- 84-87: height = 3
- 88-91: height = 1