QUESTION IMAGE
Question
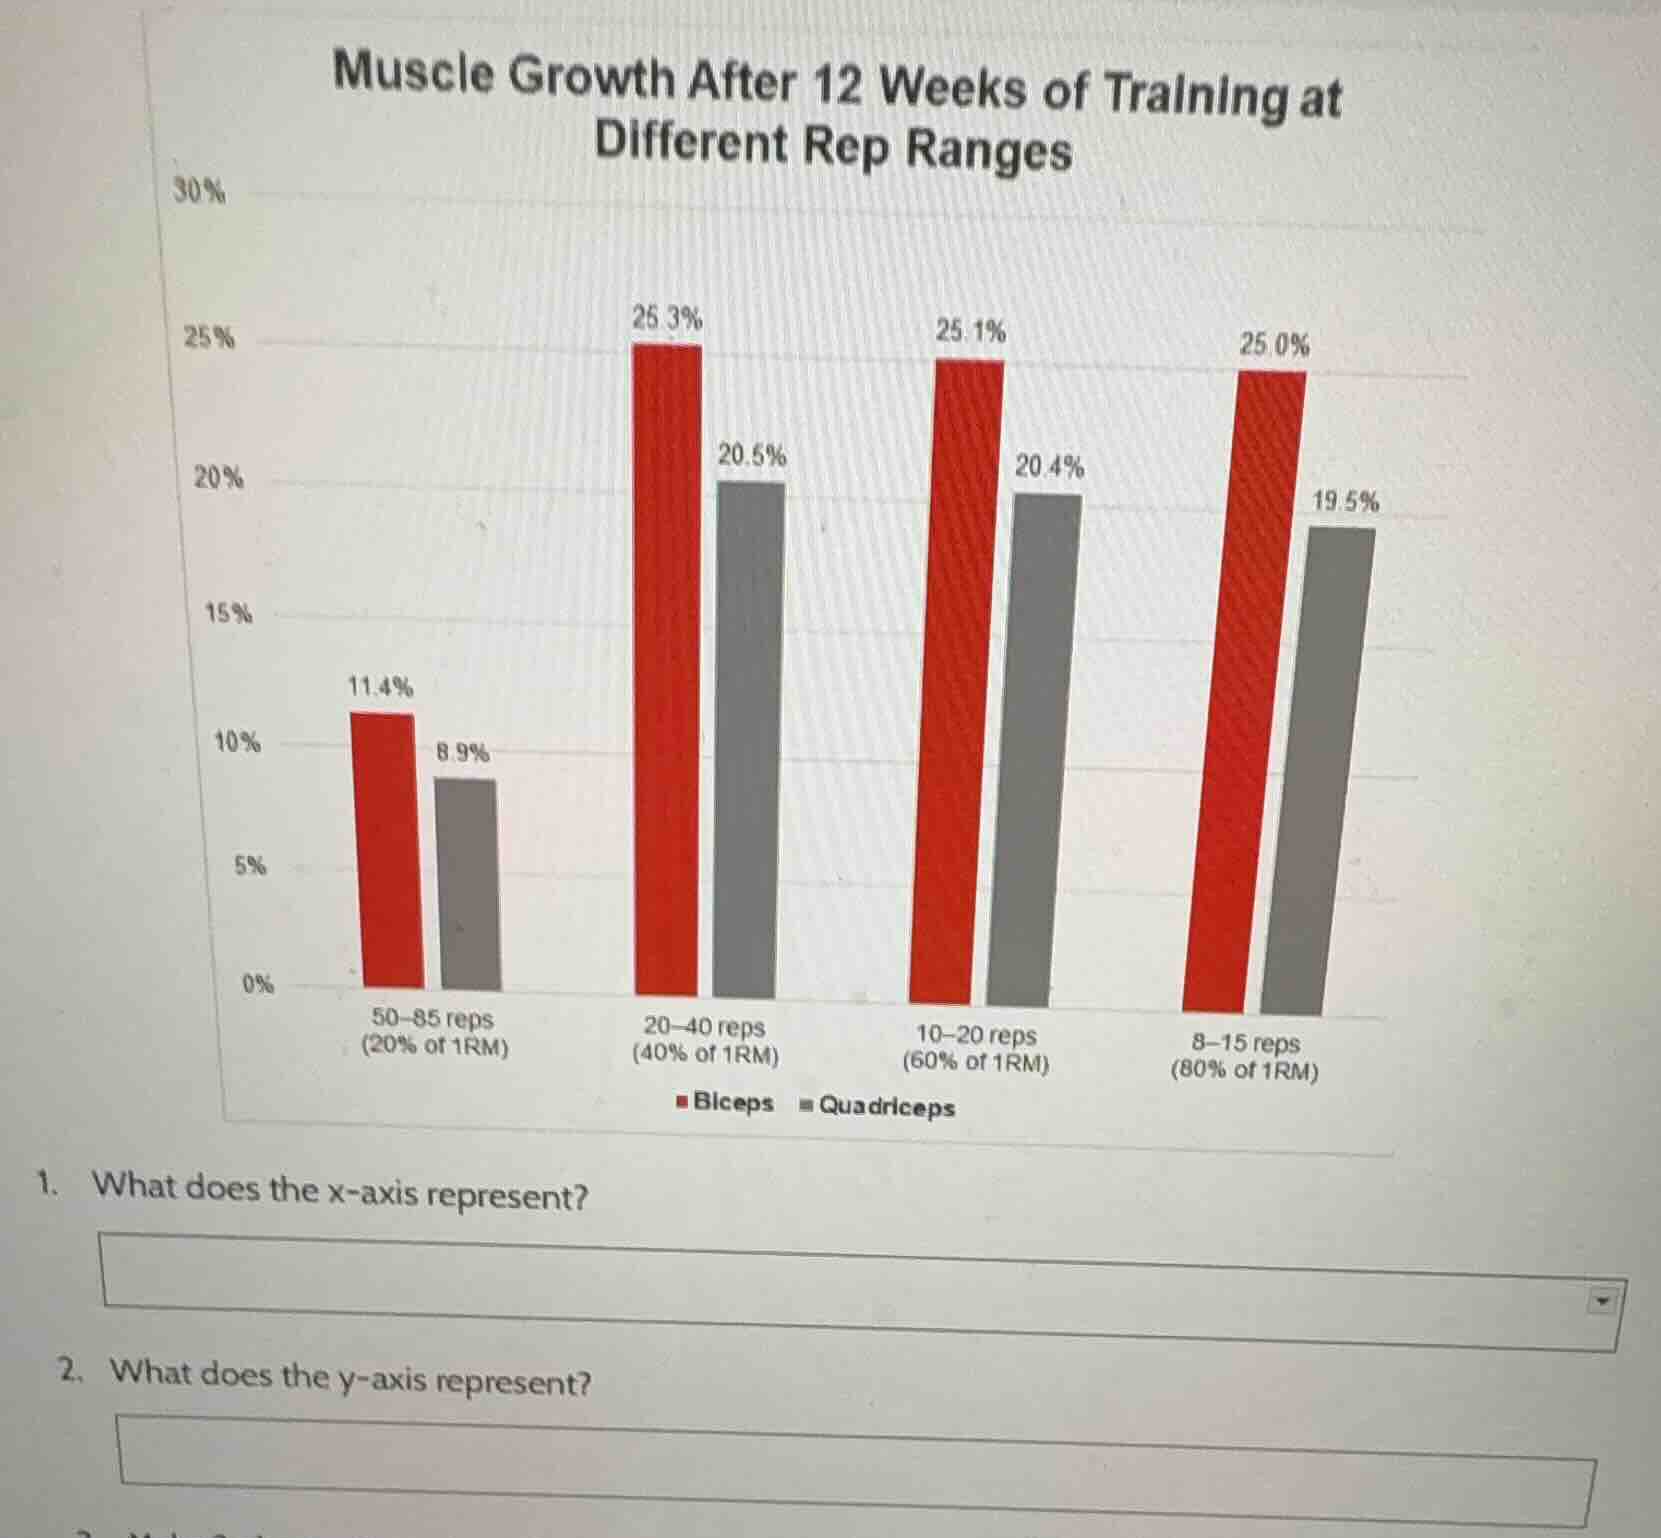
muscle growth after 12 weeks of training at different rep ranges
- what does the x - axis represent?
- what does the y - axis represent?
Brief Explanations
- The x-axis labels list different rep ranges paired with their corresponding percentage of 1-repetition maximum (1RM), which are the training variables tested in the study.
- The y-axis has percentage values, and the chart title specifies it measures muscle growth after 12 weeks of training, so this axis shows the percentage of muscle growth.

Snap & solve any problem in the app
Get step-by-step solutions on Sovi AI
Photo-based solutions with guided steps
Explore more problems and detailed explanations
- Different training rep ranges (with corresponding % of 1RM)
- Percentage of muscle growth after 12 weeks of training